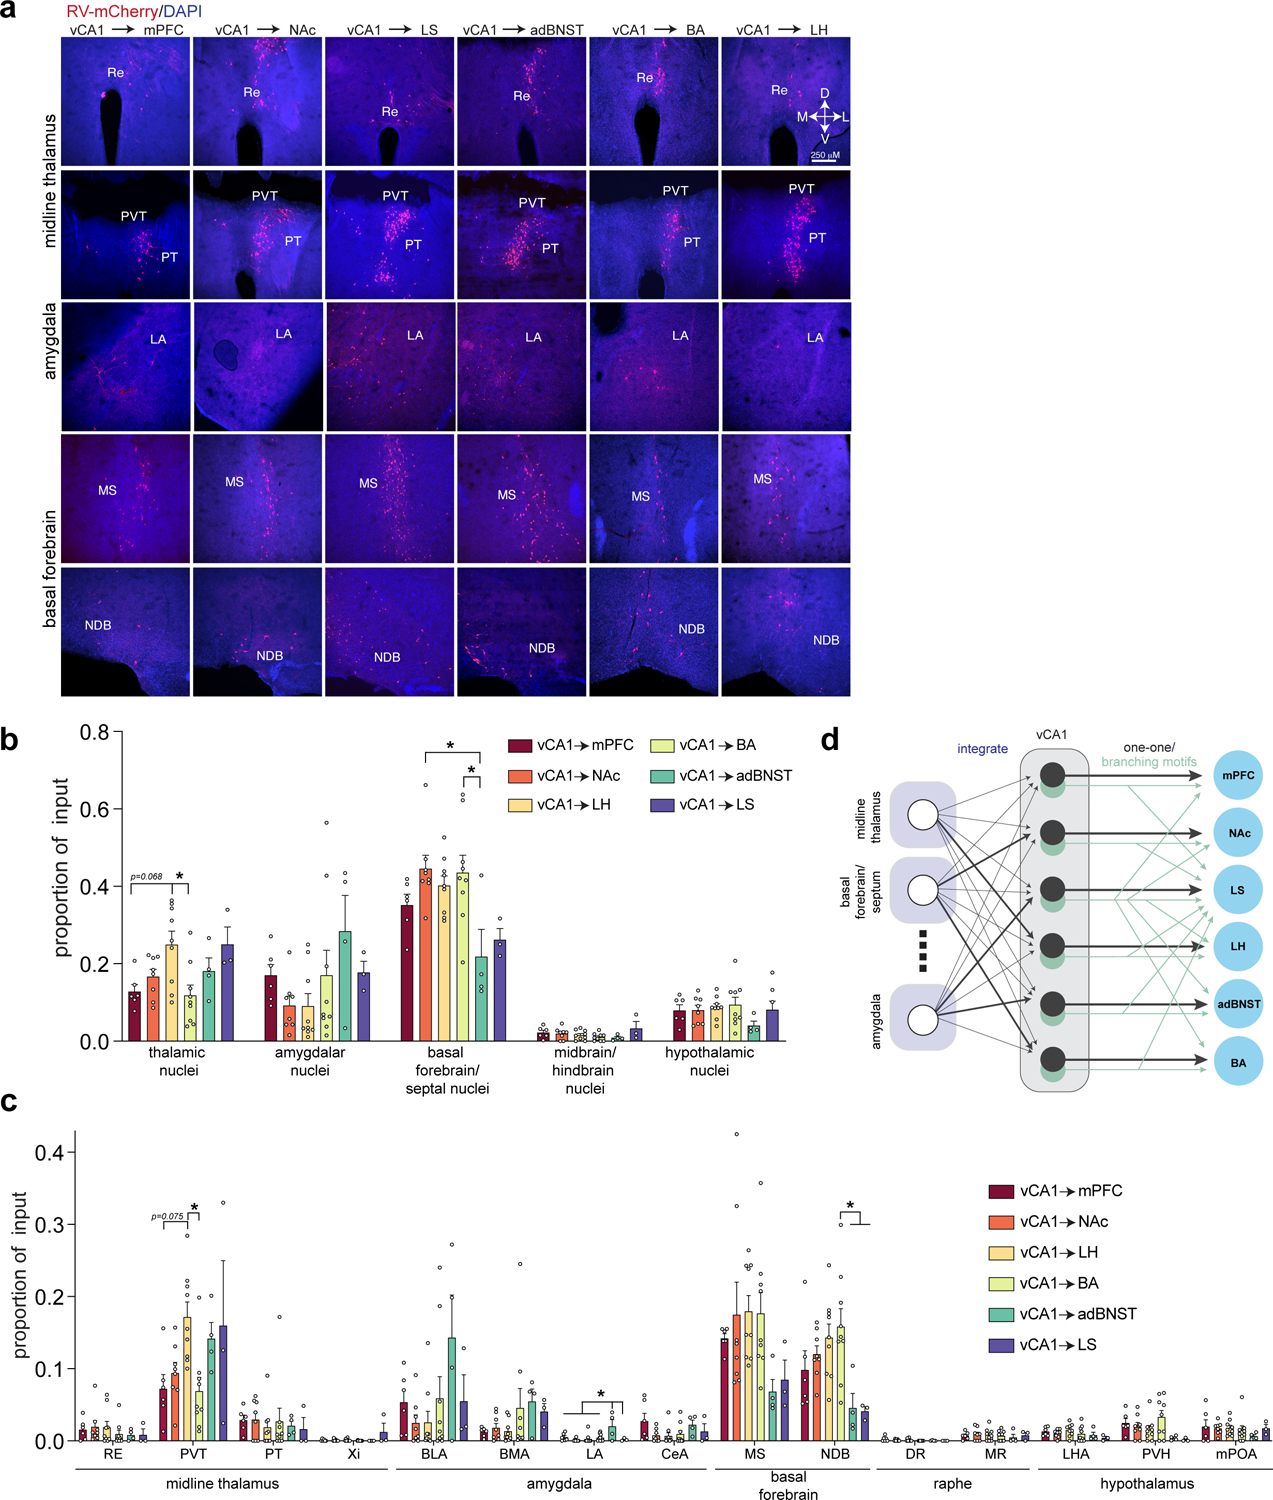
Figure 4. RV labeled inputs to vCA1 output neurons.

a. Representative images of extra-hippocampal long-range input neurons in the thalamus, amygdala and basal forebrain (from n= 6 vCA1-mPFC, 8 vCA1-NAc, 9 vCA1-LH, 9 vCA1-BA, 4 vCA1-adBNST and 3 vCA1-LS mice). b. Fraction of total extra-hippocampal input neurons found in thalamus, amygdala, basal forebrain, midbrain/hindbrain, and hypothalamus. One-way ANOVA, followed by post-hoc comparisons, with Holm-Sidak correction for multiple comparisons, all tests are two-sided. (*Padj<0.05 for post-hoc comparisons after correction for multiple comparisons. Thalamic nuclei: vCA1-LH vs. vCA1-BA, t33=3.652, Padj=0.0133, vCA1-mPFC vs. vCA1-LH t33=3.008, Padj=0.0679. Basal forebrain/septal nuclei: NAc vs. adBNST, t33= 3.649, Padj= 0.0134, BA vs. adBNST t33= 3.551, Padj= 0.0164). All statistical tests and P-values provided in Supplementary Data Table 2. c. Of the 5 areas in (b), we analyzed proportion of input to each projection population in 15 input areas using one-way ANOVAs, followed by post-hoc comparisons, with Holm-Sidak correction for multiple comparisons. All tests are two-sided. (*p<0.05 for post-hoc comparisons after correction for multiple comparisons. PVT: CA1-LH vs. vCA1-BA, t33= 3.421, Padj= 0.0249, vCA1-mPFC vs. vCA1-LH t33= 2.966, Padj= 0.0752. LA: mPFC vs. adBNST t33= 3.243, Padj= 0.0294, NAc vs. adBNST t33= 4.358, Padj= 0.0018 LH vs. adBNST t33= 4.013, Padj= 0.0045 BA vs. adBNST t33= 3.612, Padj= 0.0129, adBNST vs. LS t33= 3.320, Padj= 0.0261. NDB: BA vs. adBNST t33= 3.339, Padj= 0.0309 BA vs. LS t33= 3.133, Padj= 0.0495). See Supplementary Data Table 2 for proportion counts (mean +/− SEM) for assayed input regions, statistical tests and p-values. Error bars represent SEM. Abbreviations: RE-nucleus of reuniens, PVT-paraventricular nucleus of the thalamus, PT-parataenial nucleus, Xi-xiphoid thalamic nucleus, BLA-basolateral amygdala, BMA-basomedial amygdala, LA-lateral amygdala, CeA-central amygdala, MS-medial septum, NDB-diagonal band nucleus, DR-dorsal raphe nucleus, MR-median raphe, LHA-lateral hypothalamic area, PVH-paraventricular nucleus of hypothalamus, mPOA-medial preoptic area d. Schematic of input-output connection patterns in vCA1. vCA1 largely integrates input from upstream areas, with some biases in the proportion of input (darker lines) from thalamus, amygdala and basal forebrain. Then, this information is output to the 6 targets by cells that either form one-one connections (in black) with a given target, or those that branch to multiple downstream areas (in light green). See Figure 2 and Supplementary Data Table 1 for different branching motifs.
