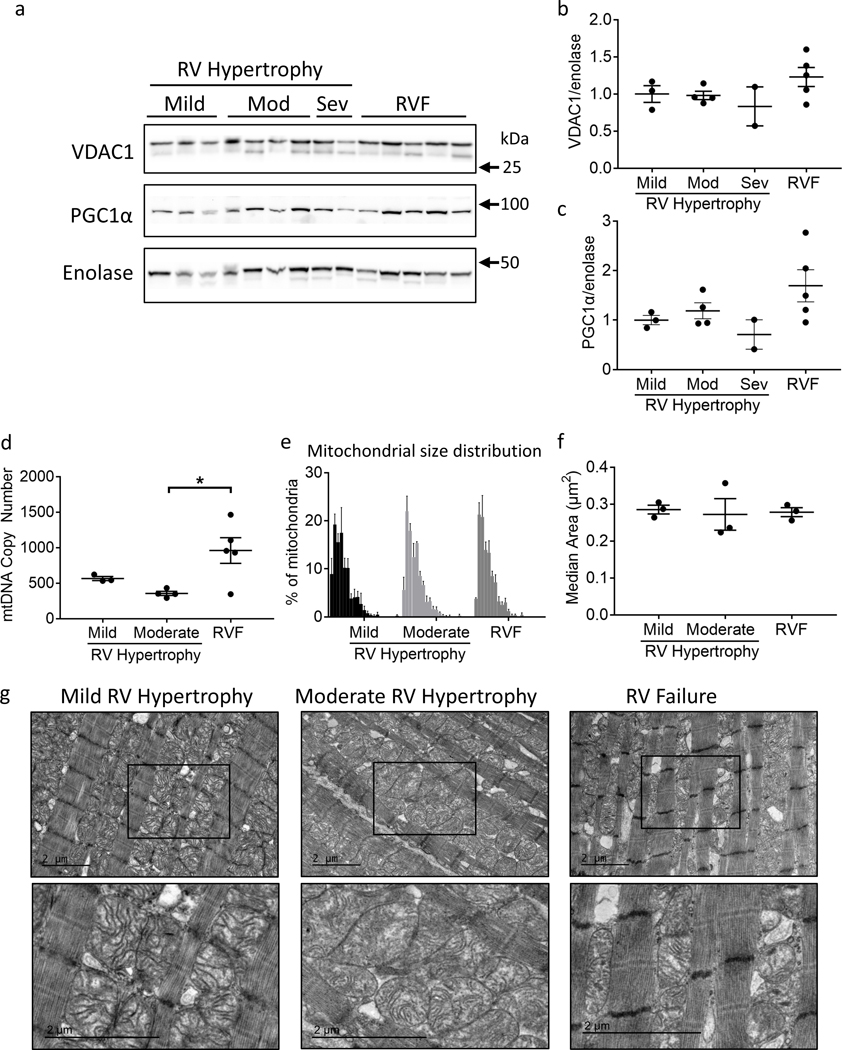
Figure 3.
Patients with RV failure demonstrate mitochondrial structural changes. (a-c) Both VDAC1 (mitochondrial protein) and PGC1α (mitochondrial biogenesis factor) trended toward an increase in RV failure (N=2–5/group). (d) Mitochondrial DNA copy number was not different between mild and moderate RV hypertrophy groups, but was significantly increased from moderate RV hypertrophy to RV failure (N=3–5/group). (e) Histogram of mitochondrial size distribution for each group by transmission electron microscopy demonstrates no difference in mitochondrial size. Each bin represents increments in mitochondrial area of 0.1 μm2 from left to right. Range is 0 to 2 μm2. (f) No significant difference was observed in median mitochondrial area. (g) Representative transmission electron microscopy images. Mitochondria become more rounded in moderate RV hypertrophy and more irregular in shape in RV failure, with a loss of defined cristae structure. Scale bars are 2 μm. N=3/group. Mod – moderate; Sev – severe; mtDNA – mitochondrial DNA; RV – right ventricle; RVF – right ventricular failure. Data are presented as mean±SEM. *p<0.05.

