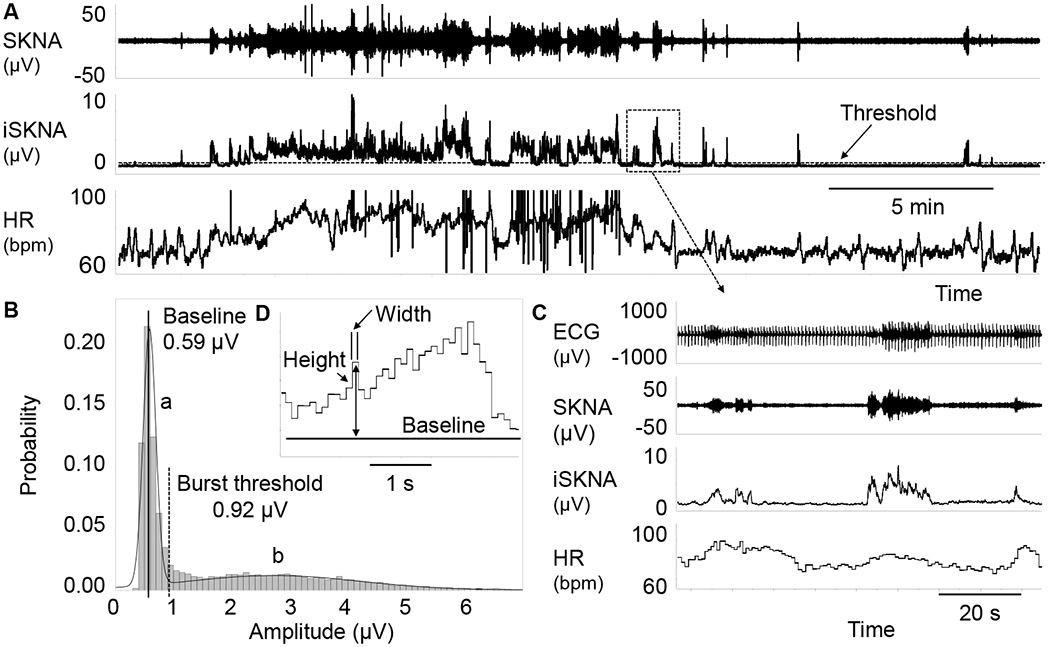
Figure 1.

The methods for SKNA burst analysis. Panel A shows SKNA, iSKNA and HR. The broken line on iSKNA channel represents the threshold for burst detection. Plot B shows iSKNA values, with two normal distributions. The distribution on the left (a) represents the baseline signal and the distribution on the right (b) represents the burst activity. A vertical solid line indicates the mean while a broken line indicates 3X the standard deviation, which is taken as the threshold for burst detection. Panel C shows zoom-in of the box in Panel A, with positive association between HR and SKNA bursts. Graph D shows the method for burst area calculation. Each bin has a width of 0.1 s. The height of each bin is calculated as the absolute amplitude minus baseline. The area is calculated by multiplying width (s) with height (μV). The areas of all bins detected are added together as the burst area μV.s). HR, heart rate; iSKNA, integrated SKNA; SKNA, skin sympathetic nerve activity recorded by ECG patch electrodes.
