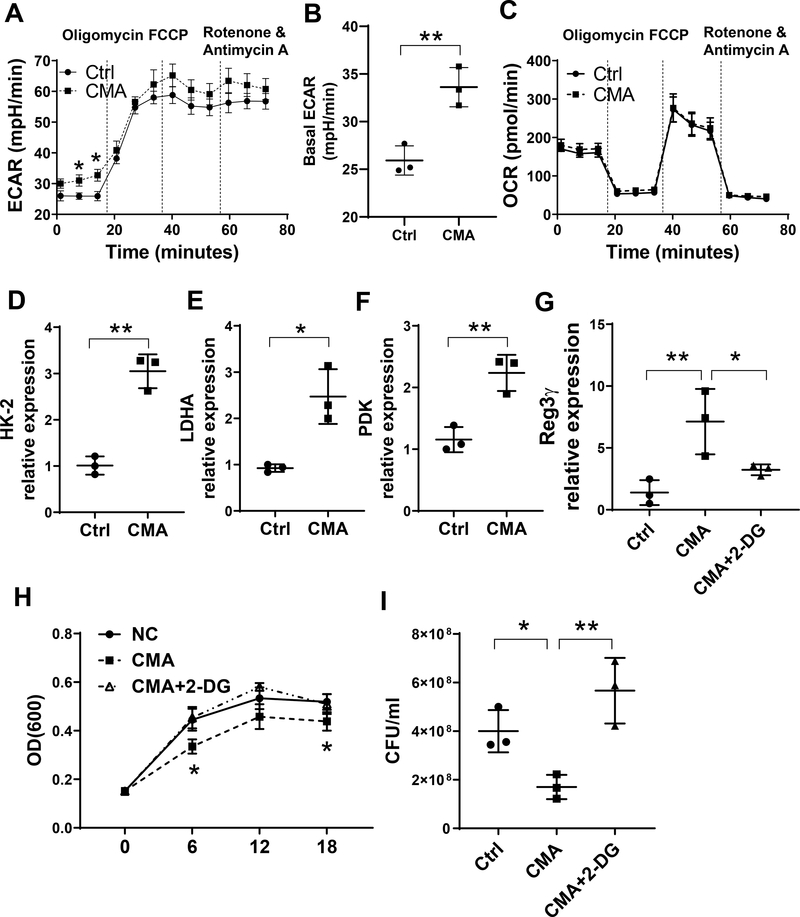
Figure 5. Glycolysis is involved in STING induction of REG3γ in IEC.
(A-C) MSIE cells (n = 3/group) were treated with or without 50 μg/ml CMA for 24 hrs. The levels of ECAR (A-B) and OCR (C) were measured by Seahorse. (D-F) MSIE cells (n = 3 /group) were treated with or without 50 μg/ml CMA for 24 hrs. The expression of HK-2 (D), LDHA (E), and PDK (F) was determined by qRT-PCR and normalized against GAPDH. (G) MSIE cells (n = 3/group) were treated with or without 50 μg/ml CMA in the presence or absence of 2-DG (1 μM) for 24 hrs, REG3γ was determined by qRT-PCR and normalized against GAPDH. (H-I) MSIE cells were treated with or without 50 μg/ml CMA in the presence or absence of 2-DG (1 μM) for 24 hrs. Citrobacter rodentium were cultured with the crude extracts of the cells. (H) The OD values (600 nm) were measured at different time points. (I) Bacterial culture suspensions were colonized to solid culture plates for colony counting overnight after treated with the extracts of IEC at 6 hrs. *p < 0.05, **p < 0.01. Data are represented as means ± standard deviation. One representative of 2–3 experiments with similar results was shown.

