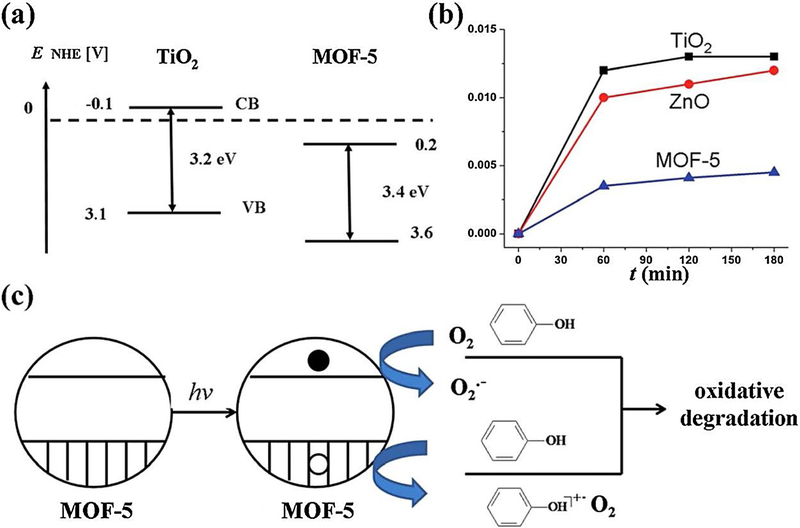
Fig. 11.
(a) Calculated values of the band gaps and position of the conduction and valence bands (CB and VB) for MOF-5 in comparison with those of commercial TiO2. (b) A time conversion plot of the phenol disappearance (y axis represents “mol of phenol decomposed per g per mol”). (c) A possible mechanistic proposal towards the photodegradation of phenol utilizing MOF-5 photocatalyst. Reproduced with permission from Ref (Alvaro et al., 2007).

