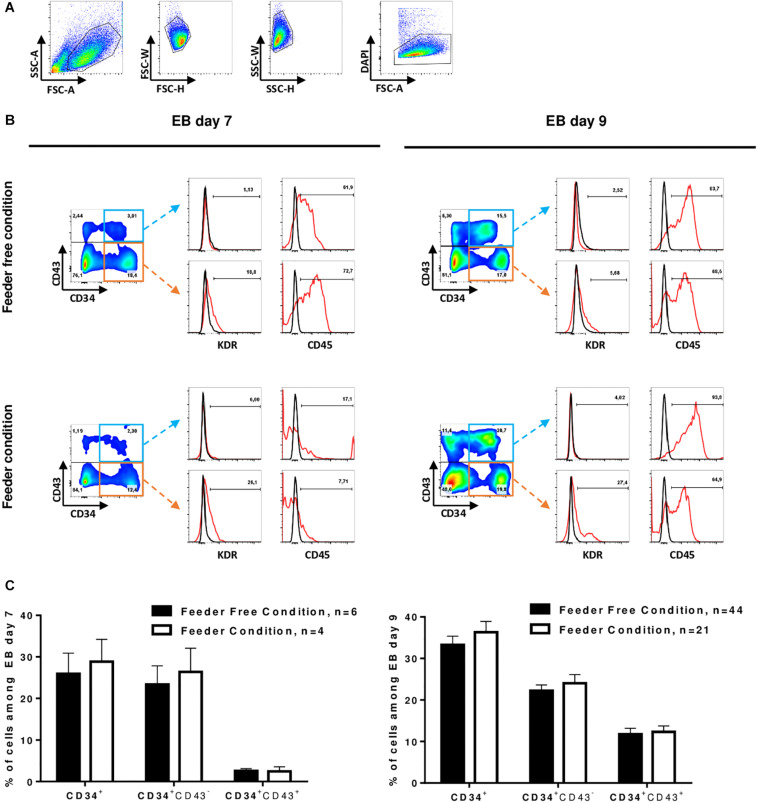
FIGURE 2.
Induction of HSPCs. (A) Representative gating strategy for differentiated cells analysis by flow cytometry: differentiated cells were selected on morphology after exclusion of doublets and dead cells (DAPI). (B) Flow-cytometry analysis of differentiating cells at D7 (left) and D9 (right) in EB culture from hPSC in feeder-free condition (top) and in feeder condition (bottom). Representative dot plot of CD34 and CD43 co-staining on living cells is shown on the left. The expression of KDR and CD45 in CD34+CD43+ (top) or CD34+CD43– (bottom) cells is shown on the right. Red line represents cells stained with a fluorescent antibody and black line represents unstained cells. (C) Percent of total cells from EBs day 7 (left) and day 9 (right) expressing the markers, Mean ± SEM are represented.

