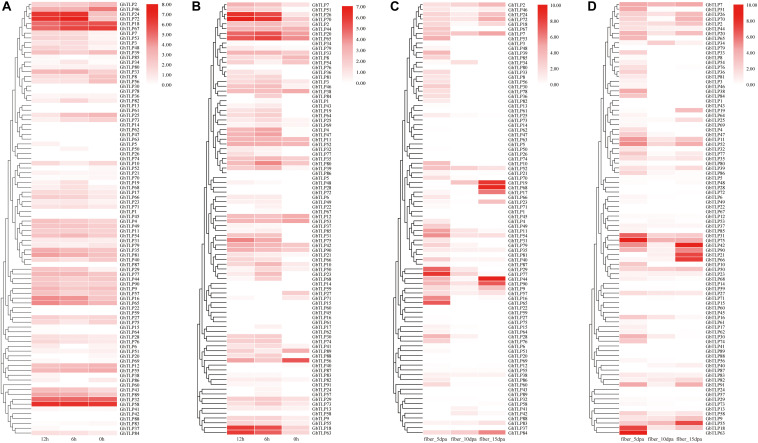
FIGURE 4.
The expression patterns of the TLPs under V. dahliae treatment and during fiber development via qRT-PCR. (A,B) Show the expression patterns of the TLPs at 0, 6, and 12 h after CCRI36 and Hai7124 were inoculated with V. dahliae, respectively. (C,D) Show the expression profiles of the TLPs in 5 dpa, 10 dpa and 15 dpa fibers of CCRI36 and Hai7124 after flowering, respectively. The color represents TLP expression profiles: Log2 (expression levels). Three independent biological replicates and three technical replicates for each PCR reaction were included.

