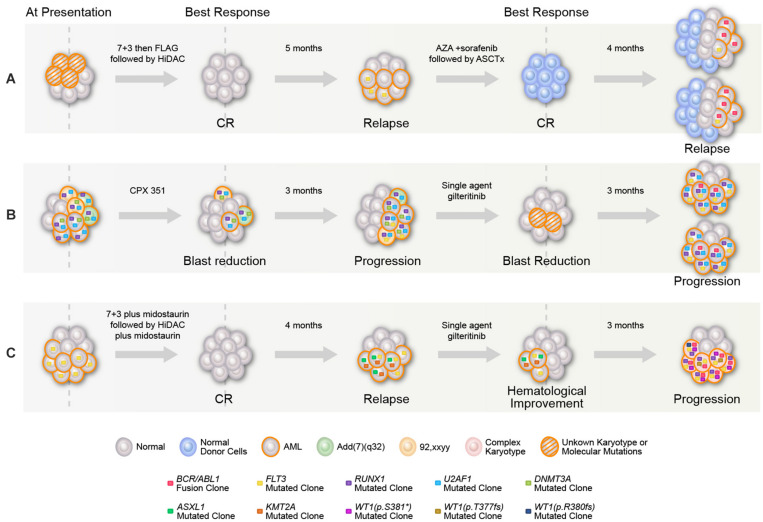
FIGURE 1.
Graphical representation of mutational acquisition/expansion. (A) Patient 1, (B) patient 2, and (C) patient 3. Clonal size was estimated based on variant allelic frequency (VAF) for mutations detected by NGS, allelic ratio for FLT3, percentage of BCR–ABL to ABL transcripts, and number of aberrant metaphases in karyotype. Clones could have coexisted or be mutually exclusive, mutations with high clonal size at the same given point of time were considered to be coexisted, for other mutations, the two possibilities were represented. At last relapse/progression in (A,B), the two branch graphs represent the possibility of coexistence or mutually exclusivity of FLT3 mutation and BCR/ABL.

