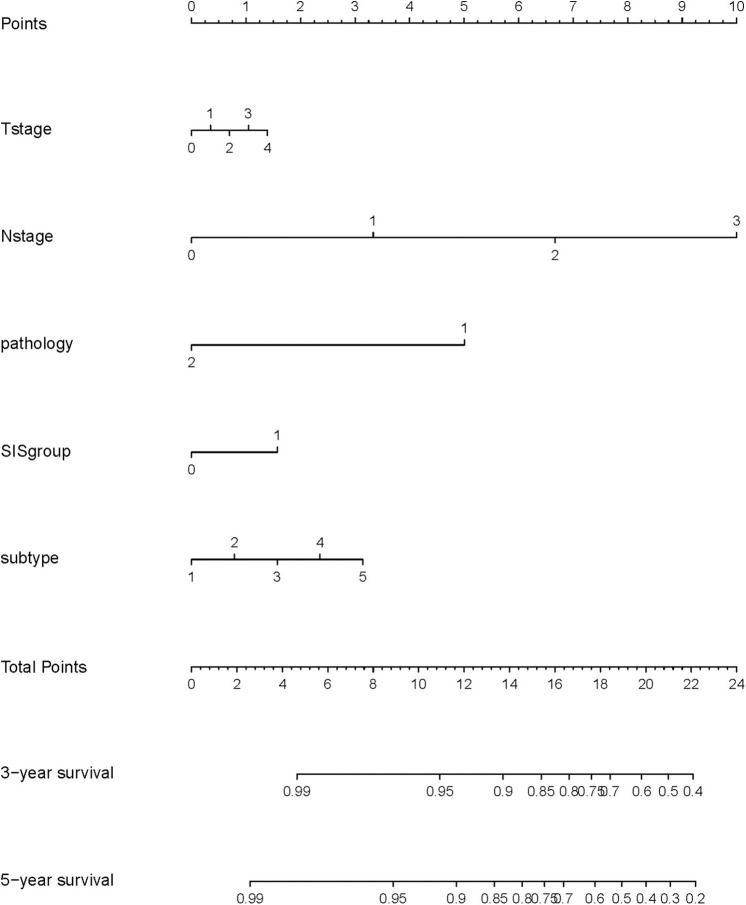
Figure 2.
A nomogram predicting the 3- and 5-year overall survival of postoperative breast cancer patients. T stage: 0: T0; 1: T1; 2: T2; 3: T3; 4: T4. N stage: 0: N0; 1: N1; 2: N2; 3: N3. Pathology: 1: invasive ductal carcinoma; 2: others. SIS group: 0: low SIS group; 1: high SIS group. Subtype: 1: Luminal A; 2: Luminal B/HER2-; 3: Luminal B/HER2+; 4: HER2 Enriched; 5: Triple Negative.

