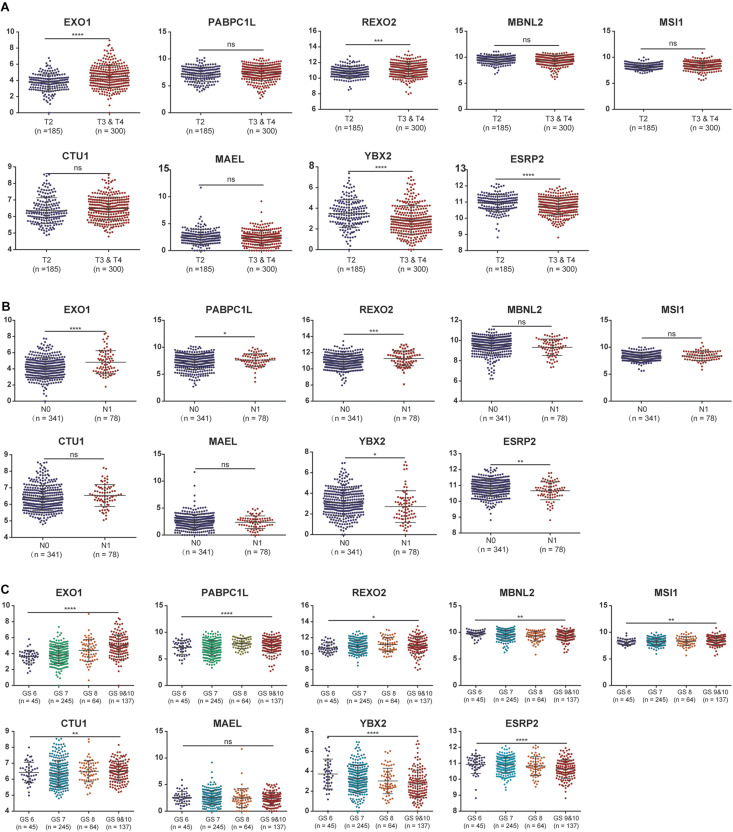
FIGURE 5.
The associations between the expression levels of the nine RNA binding proteins and clinical factors. (A) T2 staging vs. T3 and T4 staging; (B) N0 staging vs. N1 staging. (C) Gleason score for 6, 7, 8, 9, and 10. ns: P > 0.05; *P < 0.05; **P < 0.01; ***P < 0.001; ****P < 0.0001. GS represents the Gleason score.

