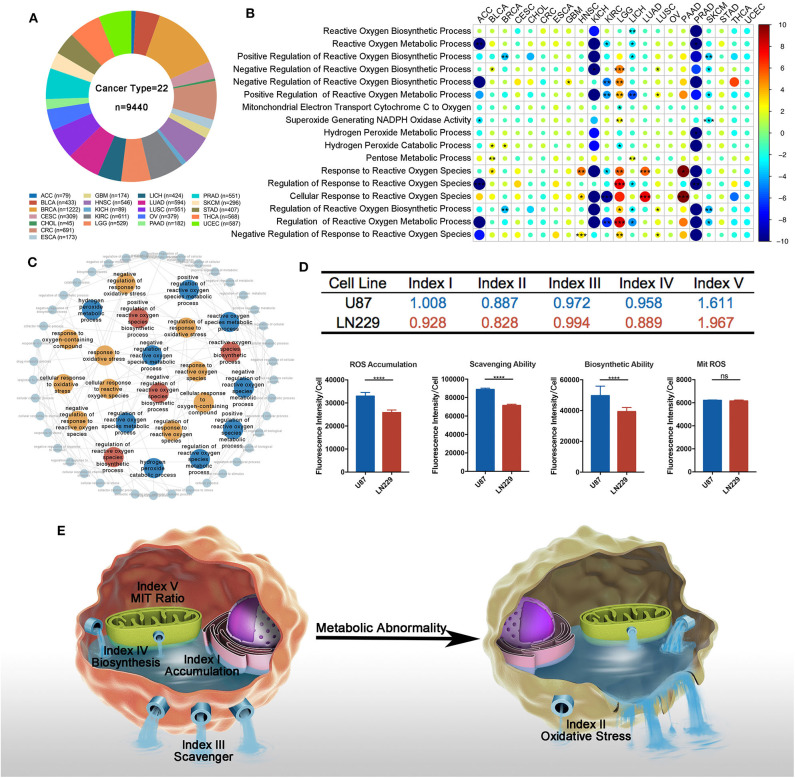
Figure 1.
Overview of reactive oxygen species (ROS) metabolism across different cancer types. (A) Sample composition in this study (cancer types = 22, n = 9,440). Sample number varied from 45 in CHOL to 1,222 in BRCA. (B) Univariate cox results of each ROS metabolism-related gene set score in different cancer types. All ROS metabolic processes show prognostic values at least in one cancer type; 15 cancer types were determined at least by one ROS process; 13 processes exerted divergent prognostic roles in different cancer types. red = risk factor, blue = protective factor; *p < 0.05, **p < 0.01, ***p < 0.001; hazard ratio (HR) lesser than 1 is transformed into (-1) * 1/HR. (C) Interactions between ROS-metabolism-related gene signatures and other related signatures: red = biosynthetic related signatures, blue = metabolic-related signatures, yellow = response-related signatures. (D) Computational comparison and experimental comparison of ROS metabolism between U87 and LN229. U87 showed a higher ROS accumulation, a stronger ROS scavenging ability, a stronger ROS generating ability, and a severer ROS stress condition compared to LN229. ****p < 0.0001. (E) Overview of ROS-metabolism-related indexes: index I, ROS accumulation; index II, oxidative stress; index III, ROS scavenging ability; index IV, ROS biosynthetic ability; and index V, subcellular ROS origins.

