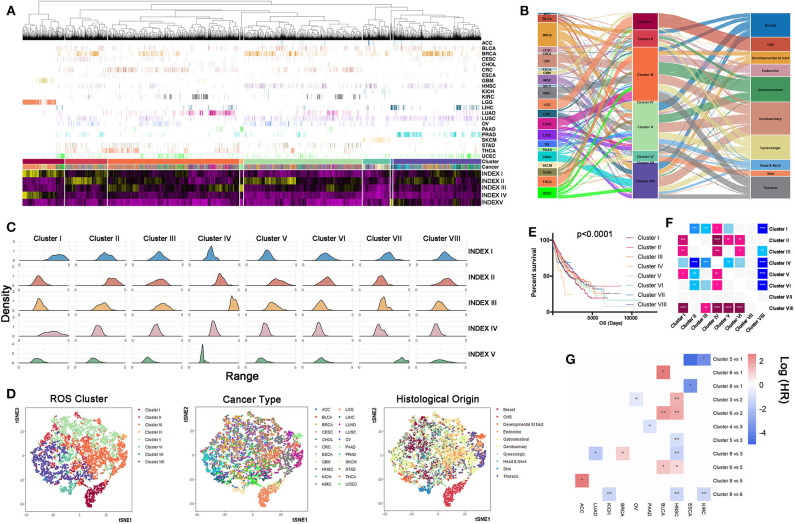
Figure 3.
Samples can be reclassified into different clusters according reactive oxygen species (ROS) indexes. (A) Clustering analyses of samples based on ROS indexes: from left to right, cluster I to cluster VIII. Cluster III had the largest number of samples, while cluster VII had the lowest number of samples. (B) Distribution density of each index in each cluster: from left to right, cluster I to cluster VIII. Cluster I was characterized by high ROS levels and enhanced biosynthetic processes. Cluster II exhibited elevated oxidative stress levels. Cluster IV was characterized by a reinforced ROS scavenging phenotype. Cluster VII tumors were associated with ROS generated from the mitochondria. (C) The composition of cancer types and histological origins in each cluster: left, cancer type; middle, clustering cluster; right, histological origin. Clusters I, IV, and VII were relatively homogenous, whereas other clusters were heterogeneous. (D) t-SNE based reducing dimension analysis using ROS indexes, cancer types, or histological origins to separate cancer samples. ROS indexes could be used to reclassify The Cancer Genome Atlas samples. (E) Survival curves of clusters (I–VIII), using the log-rank method. Clusters I and IV had significantly reduced survival times, while cluster II and VIII had significantly prolonged survival times. (F) Comparison of prognosis differences between each cluster: *p < 0.05, **p < 0.01, ***p < 0.001, ****p < 0.0001. Horizontal direction: blue = poor prognosis, pink = good prognosis. Vertical direction: pink = poor prognosis, blue = good prognosis. (G) Survival comparison of cancers between different clusters: *p < 0.05, **p < 0.01.

