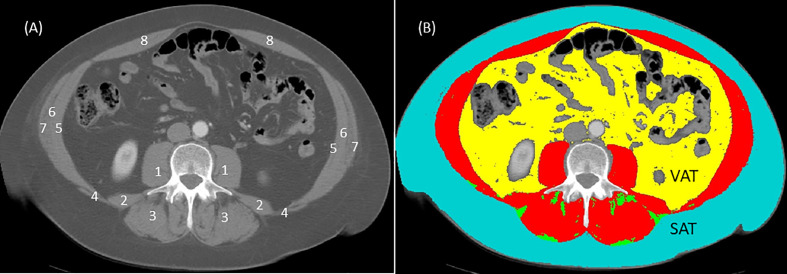
Figure 1.
Computed tomography (CT) image at third lumbar (L3) before (A) and after (B) analysis using sliceOmatic software (Tomovision, Montreal, Quebec, Canada). In the image without coloring (A), individual muscle groups are represented by numbers and these are: 1 = psoas; 2 = quadratus lumborum; 3 = erector spinae; 4 = latissimus dorsi; 5 = transversus abdominis; 6 = internal obliques; 7 = external obliques; 8 = rectus abdominis. In the image with coloring (B), analysis is based on Hounsfield unit thresholds for each tissue: skeletal muscles (red) -29 to 150 HU; subcutaneous adipose tissue (SAT) in teal and intermuscular adipose tissue (IMAT) in green -30 to -190 HU; visceral adipose tissue (VAT) in yellow -50 to -150 HU; air in black -1,000 HU; bone (L3 vertebra) 400 to 4,000 HU). Skeletal muscle index (SMI) is calculated from the total surface area (cm2) of skeletal muscles (in red, image (B) normalized (divided) for height (m2). For example, the total L3 skeletal muscle (in red, image (B) for this image is 166 cm2 assuming that this person is female with a height of 164 cm or 2.68 m2 the SMI for this person = 166 cm2/2.68 m2 or 61.4 cm2/m2. Using the Prado et al. (32) cut off of SMI < 38 cm2/m2 for women, this individual would not have sarcopenia. Some researchers use single muscle groups such as the psoas muscles (1 in image (A) normalized for height to determine sarcopenia. Although using single muscle groups to determine sarcopenia is debatable, only the surface area for both psoas muscles (1 in image (A) would be used to calculate psoas muscle index (PMI). Thus, PMI = psoas muscle surface areas (cm2) divided by height (m2).

