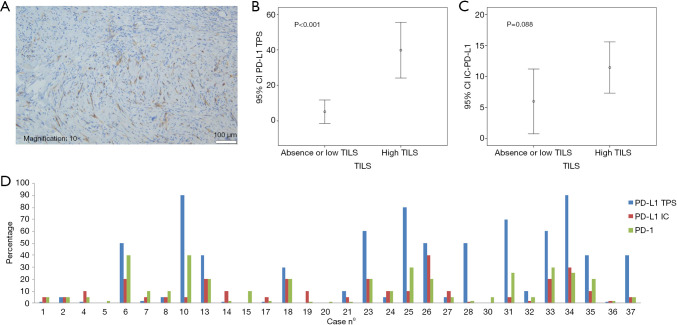
Figure 3.
Expression of PD-L1. (A) PD-L1 positive case on tumor and immune cells (PD-L1 22C3 clone); (B) association plot of TILS and PD-L1 expression in tumor cells (TPS score); (C) association plot of TILS and PD-L1 expression in immune cells (IC score); (D) bar chart showing the PD-L1 and PD-1 expression in DM patients. DM, desmoplastic melanoma; IC, immune cells; PD-L1, programmed death ligand 1; TILS, tumor-infiltrating lymphocytes; TPS, tumor proportion score.

