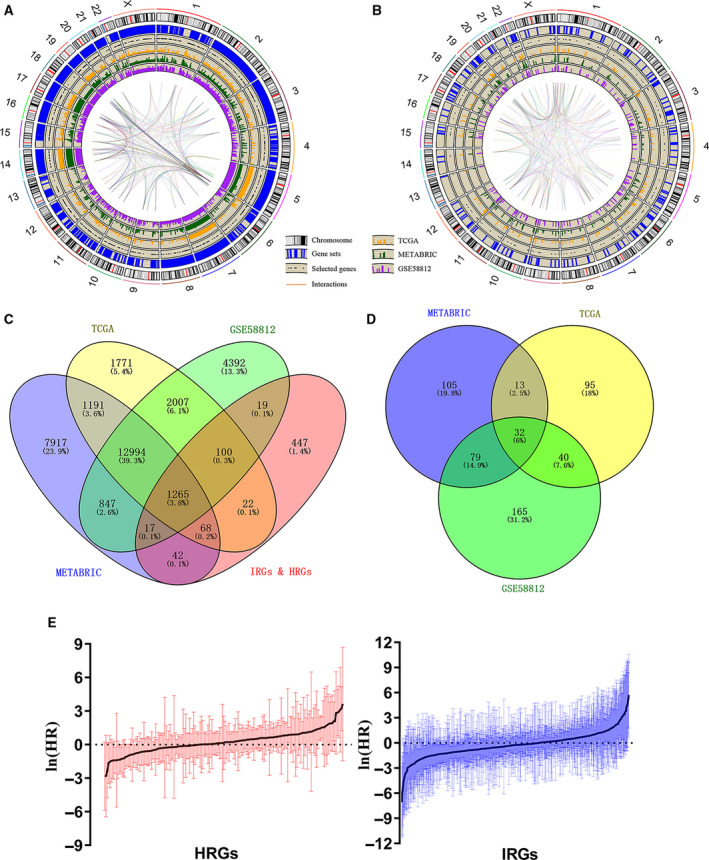
Fig. 2.

Identification of prognostic HRGs and IRGs in TNBC. (A, B) Circos plots of the annotation and interaction of HRGs and IRGs in the genome. The outer circle shows the positions of individual genes on chromosomes. The scatters in the second circle represent the identified genes in all three cohorts. The third to fifth circles indicate the relative expression levels of the identified genes in the METABRIC, TCGA, and GSE58812 cohorts. The central lines represent the potential interactions between genes predicted by the STRING database. (C) Venn diagram indicating 1265 genes identified in all three cohorts. (D) Venn diagram indicating 32 prognostic genes identified in all three cohorts. (E) Barplot showing the hazard ratio of the HRGs and IRGs in the METABRIC cohort. The bars represent the 95% CI. Univariate Cox regression was used for data analysis.
