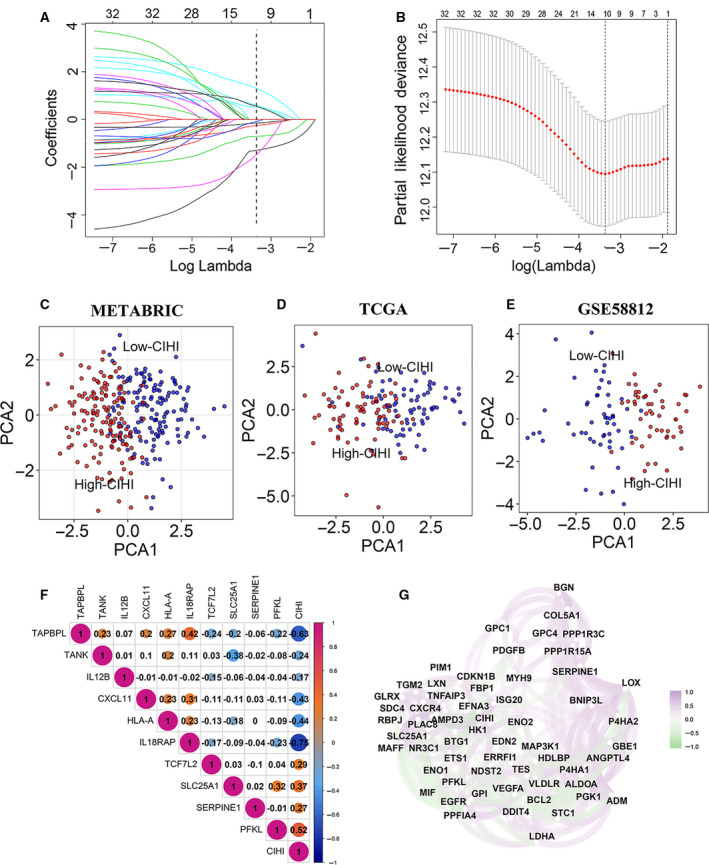
Fig. 3.

Construction of a predictive model and the CIHI. (A, B) The LASSO Cox regression model was constructed from 32 signature genes, and the tuning parameter (λ) was calculated based on the partial likelihood deviance with ten‐fold cross validation. An optimal log λ value was defined at −3.37, as shown by the vertical black lines in the plots. The ten signature genes were identified according to the best fit profile. (C–E) PCA based on the expression profile of the 10 selected signature genes according to different risk groups. (F) Correlation between the CIHI and the selected signature genes in the METABRIC cohort. (G) Correlation network between the CIHI and its correlated hypoxia‐related genes in the METABRIC cohort. Data were analyzed using Spearman’s rank correlation analysis.
