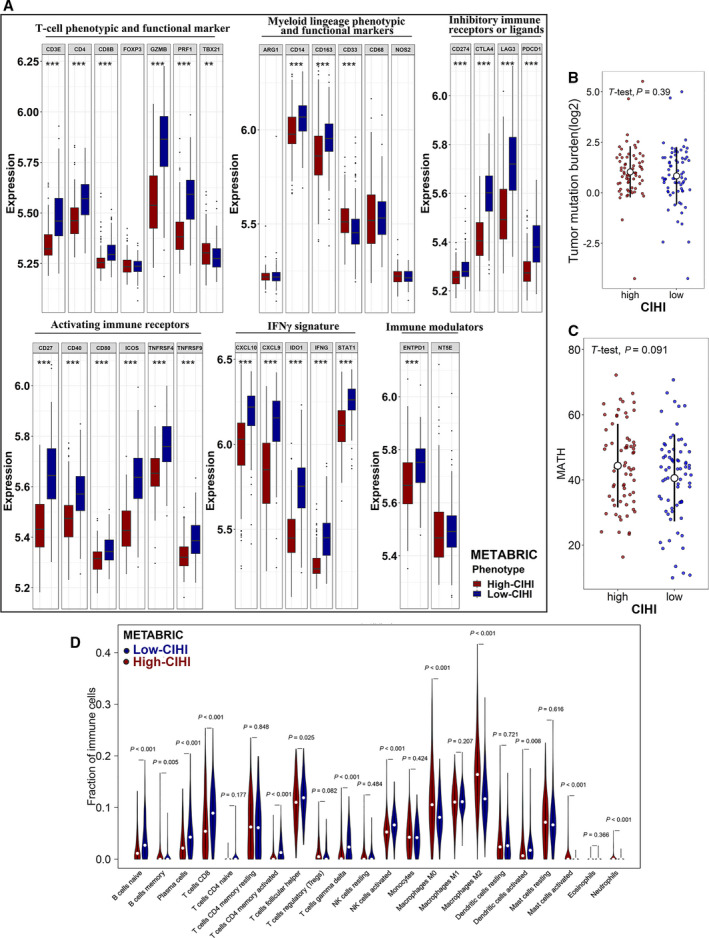
Fig. 6.

Immune‐related profiling, tumor‐infiltrating immune cells, and genomic heterogeneity in the CIHI‐based groups. (A) Box and whisker plots show the expression of selected immune‐related genes in the METABRIC cohort. (B, C) TMB and the MATH score in the high‐CIHI and low‐CIHI groups. (D) Comparison of infiltrating immune cells (CIBERSORT) between groups. The hypoxiahigh/immunelow and hypoxialow/immunehigh phenotypes are represented as dark red and dark blue, respectively. Student’s t‐test and Wilcox test were used for data analysis. P values are shown as **P < 0.01 and ***P < 0.001.
