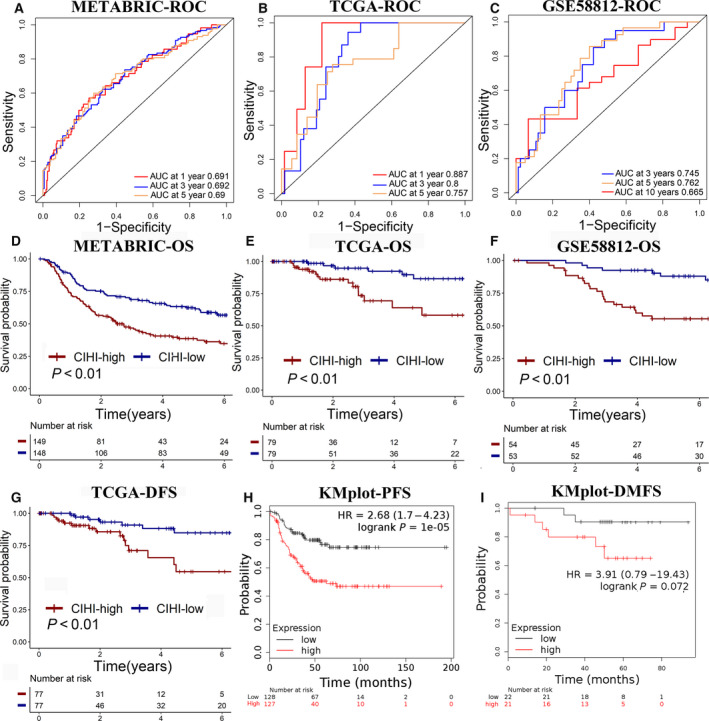
Fig. 8.

(A–C) Time‐dependent ROC analysis of the CIHI regarding OS in patients with TNBC. (D–F) Kaplan–Meier plots of OS in the CIHI‐based groups. (G) Kaplan–Meier plot of DFS in the TCGA cohort. (H, I) Kaplan–Meier plot of PFS and DMFS in the KMplot database. Log‐rank test was used for data analysis.
