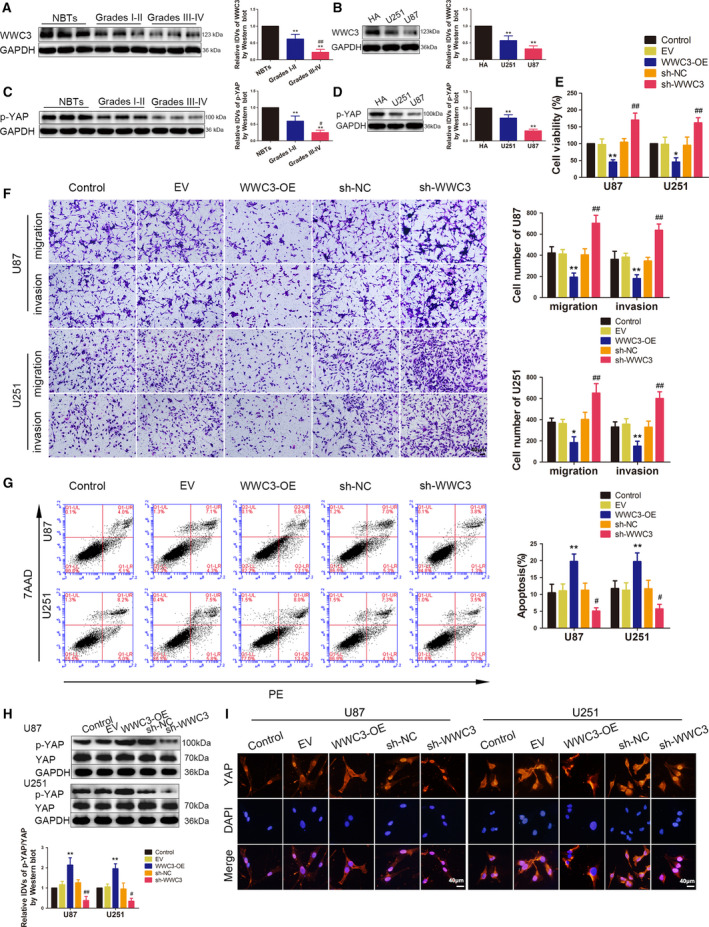
Fig. 5.

Endogenous expression of WWC3 and the effects of WWC3 on the biological behaviour of glioma cells. (A) The expression of WWC3 was measured by western blotting in NBT and glioma tissues of grade Ⅰ–Ⅱ and grade Ⅲ–Ⅳ. Data are presented as mean ± SD (n = 9, each group) and analysed by using one‐way ANOVA. **P < 0.01 vs. NBT group; ## P < 0.01 vs. grade I‐II group. (B) The expression of WWC3 was measured by western blotting in normal HA, U87 and U251 cells. Data are presented as mean ± SD (n = 3 for each group) and analysed by using one‐way ANOVA. **P < 0.01 vs. HA. (C) The p‐YAP level was measured by western blot in NBTs and glioma tissues of grade I‐II and grade III‐IV. Data are presented as mean ± SD (n = 9 for each group) and analysed by using one‐way ANOVA. **P < 0.01 vs. NBTs; # P < 0.05 vs. grade I‐II group. (D) The p‐YAP level was measured by Western blot in normal HA, U87 and U251 cells. Data are presented as mean ± SD (n = 3 for each group) and analysed by using one‐way ANOVA. **P < 0.01 vs. HA group. (E) CCK‐8 assay was used to measure the effect of WWC3 on the proliferation of U87 and U251 cells. (F) Transwell assays were used to measure the effect of WWC3 on cell migration and invasion of U87 and U251 cells. (G) Flow cytometry analysis of U87 and U251 cells treated with altered expression of WWC3. (E–G) Data are presented as mean ± SD (n = 3 for each group) and analysed by using one‐way ANOVA. *P < 0.05 vs. EV group; **P < 0.01 vs. EV group; # P < 0.05 vs. sh‐NC group; ## P < 0.01 vs. sh‐NC group. Scale bar represents 40 μm. (H) Western blotting assay was used to measure the p‐YAP level in U87 and U251 cells, which treated by WWC3 overexpression or knockdown. Data are presented as mean ± SD (n = 3 for each group) and analysed by using one‐way ANOVA. **P < 0.01 vs. EV group; # P < 0.05 vs. sh‐NC group; ## P < 0.01 vs. sh‐NC group. (I) IF microscopy images of the YAP distribution in the nucleus and cytoplasm, which treated by WWC3 overexpression or knockdown (n = 1). Scale bars represent 40 μm.
