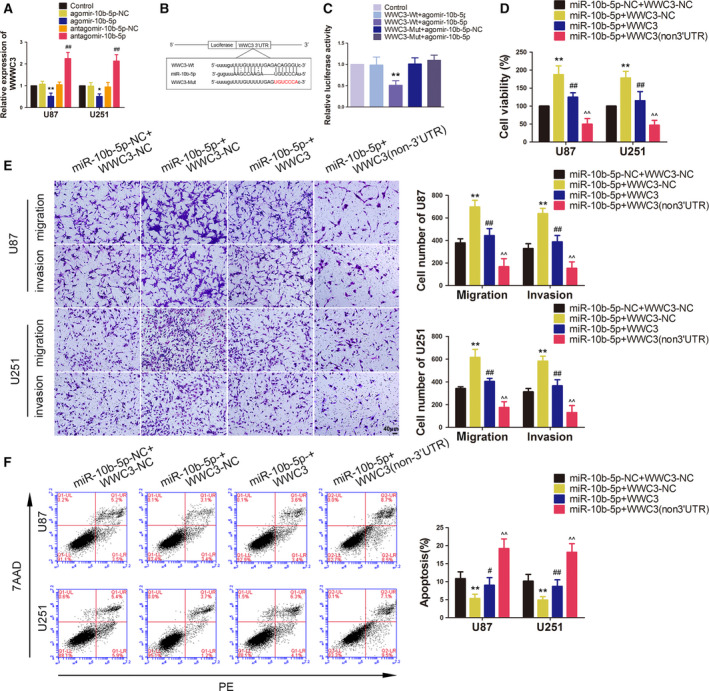
Fig. 6.

miR‐10b‐5p plays an oncogenic role in glioma cells by binding to the WWC3 3′‐UTR. (A) qRT–PCR analysis of WWC3 expression, which is regulated by miR‐10b‐5p in U87 and U251 cells. Data are presented as mean ± SD (n = 3 for each group) and analysed by using one‐way ANOVA. *P < 0.05 vs. agomir‐10b‐5p‐NC group; **P < 0.01 vs. agomir‐10b‐5p‐NC group; ## P < 0.01 vs. antagomir‐10b‐5p‐NC group. (B) The predicted binding sites of miR‐10b‐5p in the 3′‐UTR region of WWC3‐Wt and the designed mutant sequence of WWC3‐Mut are indicated. (C) Relative luciferase activity of WWC3‐Wt or WWC3‐Mut and agomir‐10b‐5p‐NC or agomir‐10b‐5p cotransfected HEK293 cells. Data are presented as mean ± SD (n = 3 for each group) and analysed by using one‐way ANOVA. **P < 0.01 vs. WWC3‐Wt+agomir‐10b‐5p‐NC group. (D) CCK‐8 assay was used to measure the effect of miR‐10b‐5p and WWC3 on the viability of U87 and U251 cells. (E) Transwell assays were used to measure the effect of miR‐10b‐5p and WWC3 on cell migration and invasion of U87 and U251 cells. (F) Flow cytometry analysis of the effect of miR‐10b‐5p and WWC3 on apoptosis in U87 and U251 cells. (D‐F) Data are presented as mean ± SD (n = 3 for each group) and analysed by using one‐way ANOVA. **P < 0.01 vs. miR‐10b‐5p‐NC+WWC3‐NC group; # P < 0.05, ## P < 0.01 vs. miR‐10b‐5p+WWC3‐NC group; ^^ P < 0.01 vs. miR‐10b‐5p+WWC3 group. Scale bar represents 40 μm.
