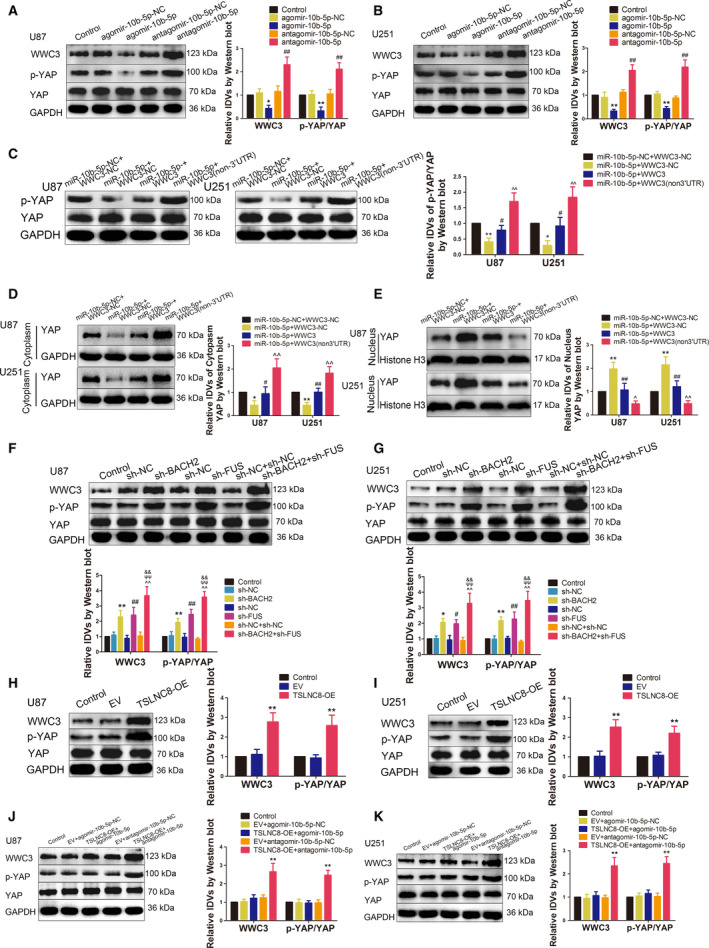
Fig. 7.

BACH2, FUS, TSLNC8 and miR‐10b‐5p regulated WWC3 expression and YAP phosphorylation levels. (A, B) Western blotting assay was used to measure WWC3 expression and p‐YAP levels in U87 and U251 cells treated with miR‐10b‐5p overexpression or knockdown. Data are presented as mean ± SD (n = 3 for each group) and analysed by using one‐way ANOVA. *P < 0.05, **P < 0.01 vs. agomir‐10b‐5p‐NC group; ## P < 0.01 vs. antagomir‐10b‐5p‐NC group. (C) Western blotting assay was used to measure the p‐YAP level in U87 and U251 cells, which are regulated by miR10b‐5p targeting WWC3 3′‐UTR. Data are presented as mean ± SD (n = 3 for each group) and analysed by using one‐way ANOVA. *P < 0.05, **P < 0.01 vs. miR‐10b‐5p‐NC+WWC3‐NC group; # P < 0.05 vs. miR‐10b‐5p+WWC3‐NC group; ^^ P < 0.01 vs. miR‐10b‐5p+WWC3 group. (D) Western blotting assay was used to measure the cytoplasmic YAP expressions in U87 and U251 cells, which are regulated by miR10b‐5p targeting WWC3 3′‐UTR. Data are presented as mean ± SD (n = 3 for each group) and analysed by using one‐way ANOVA. *P < 0.05, **P < 0.01 vs. miR‐10b‐5p‐NC+WWC3‐NC group; # P < 0.05, ## P < 0.01 vs. miR‐10b‐5p+WWC3‐NC group; ^^ P < 0.01 vs. miR‐10b‐5p+WWC3 group. (E) Western blotting assay was used to measure the nuclear YAP expressions in U87 and U251 cells, which are regulated by miR10b‐5p targeting WWC3 3′‐UTR. Data are presented as mean ± SD (n = 3 for each group) and analysed by using one‐way ANOVA. **P < 0.05 vs. miR‐10b‐5p‐NC+WWC3‐NC group; ## P < 0.01 vs. miR‐10b‐5p+WWC3‐NC group; ^ P < 0.05, ^^ P < 0.01 vs. miR‐10b‐5p+WWC3 group. (F, G) Western blotting assay was used to measure WWC3 expressions and p‐YAP levels in U87 and U251 cells, which were treated by knockdown of BACH2 and FUS. Data are presented as mean ± SD (n = 3 for each group) and analysed by using one‐way ANOVA. *P < 0.05, **P < 0.01 vs. sh‐NC group; # P < 0.05, ## P < 0.01 vs. sh‐NC group; ^^ P < 0.01 vs. sh‐NC+sh‐NC group; ψψ P < 0.01 vs. sh‐BACH2 group; && P < 0.01 vs. sh‐FUS group. (H, I) Western blotting assay was used to measure WWC3 expressions and p‐YAP levels in U87 and U251 cells, which were treated with overexpressed TSLNC8. Data are presented as mean ± SD (n = 3 for each group) and analysed by using one‐way ANOVA. **P < 0.01 vs. EV group. (J, K) Western blotting assay was used to measure WWC3 expressions and p‐YAP levels regulated by TSLNC8 and miR10b‐5p in U87 and U251 cells. Data are presented as mean ± SD (n = 3 for each group) and analysed by using one‐way ANOVA. **P < 0.01 vs. EV+antagomir‐10b‐5p ‐NC group.
