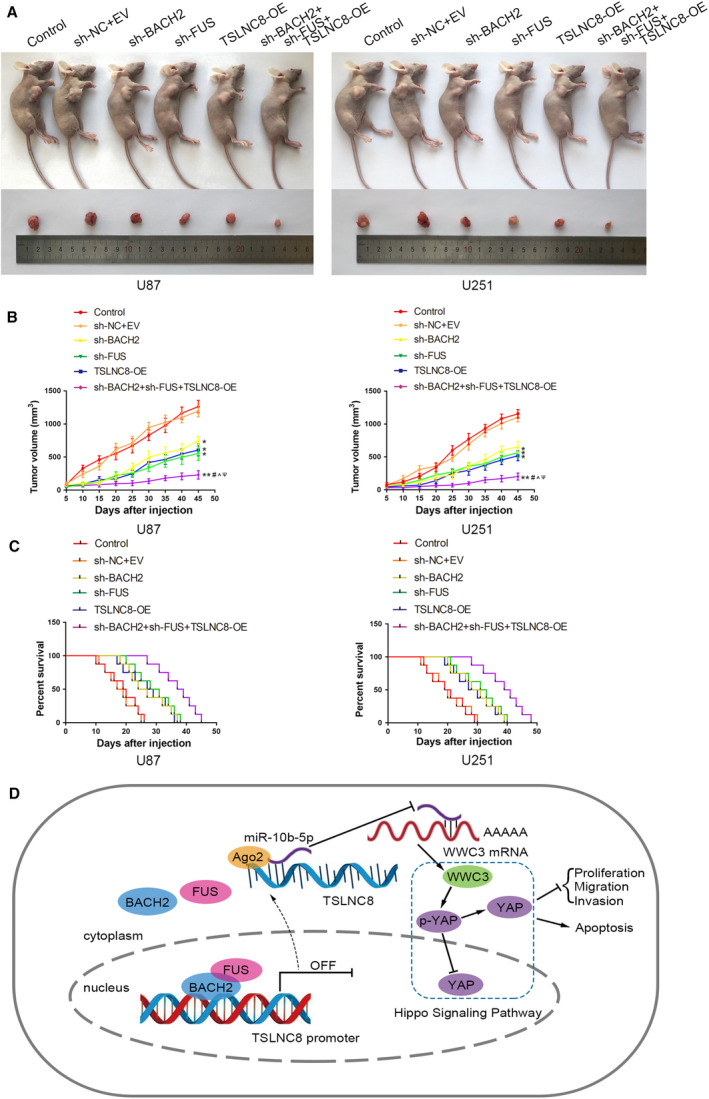
Fig. 8.

Tumour xenograft studies. (A) The nude mice carrying tumours from the respective groups are shown. The sample tumours excised from the respective groups are shown. (B) Tumour growth curves of six nude mice groups are shown, and data are presented as mean ± SD (n = 8 for each group). Tumour volume was calculated every 5 days after injection, and the tumour was excised after 45 days. Data are analysed by using one‐way ANOVA *P < 0.05, **P < 0.01 vs. control group; # P < 0.05 vs. sh‐BACH2 group; ^ P < 0.05 vs. sh‐FUS group; ψ P < 0.05 vs. TSLNC8‐OE group. (C) Survival curves of nude mice injected into the right striatum from the respective groups are shown (n = 8, each group). Data are analysed by using log‐rank test, P < 0.05 for sh‐BACH2, sh‐FUS or TSLNC8‐OE group vs. control group; P < 0.01 for sh‐BACH2+sh‐FUS+TSLNC8 group‐OE vs. control group. (D) Schematic drawing of the mechanism of the BACH2/TSLNC8/miR‐10b‐5p/wwc3 axis in glioma cells.
