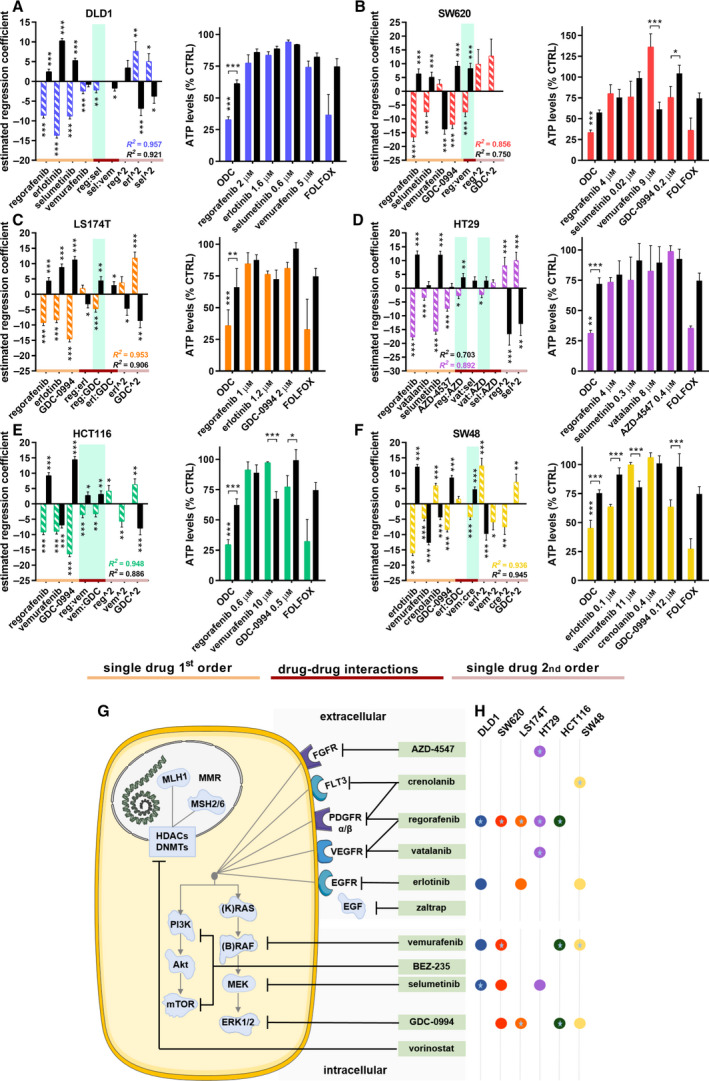
Fig. 1.

Optimized drug combination (ODC) activity and drug–drug interactions. Estimated regression coefficients of single‐drug first‐ and second‐order activity (orange line and pink line, respectively), and drug–drug interactions (red line) of the a. DLD1, b. SW620, c. LS174T, d. HT29, e. HCT116, and f. SW48 cells (colored/striped bars) and the therapeutic window (solid/black bars) in the left panel. Synergistic drug interactions are highlighted in green. Corresponding right panel presents the activity of the ODCs, corresponding monotherapies and FOLFOX (0.5 µm leucovorin, 10 µm 5‐fluorouracil, 0.5 µm oxaliplatin) as measured by the ATP levels vs. CTRL (<0.15% DMSO) of the CRC cells (colored bars) and the CCD841 healthy colon epithelial cells (black bars) used to obtain the therapeutic window (TW). Error bars represent the SD. N = 2‐6 experiments (see legends Figures S4‐S9) and significance of estimated regression coefficients is represented with *P < 0.05, **P < 0.01, and ***P < 0.001, as determined by a one‐way (left graph) or two‐way ANOVA (right graph). g. Schematic of drugs (green boxes) targeting upstream extracellular receptors or downstream intracellular signaling pathways. h. Overview of the optimized CRC cell‐specific drug combinations consisting of 3 or 4 drugs at specific drug concentrations. Colored circles represent the drugs. Drugs part of an interacting drug pair are indicated with a star.
