
Fig. 2.
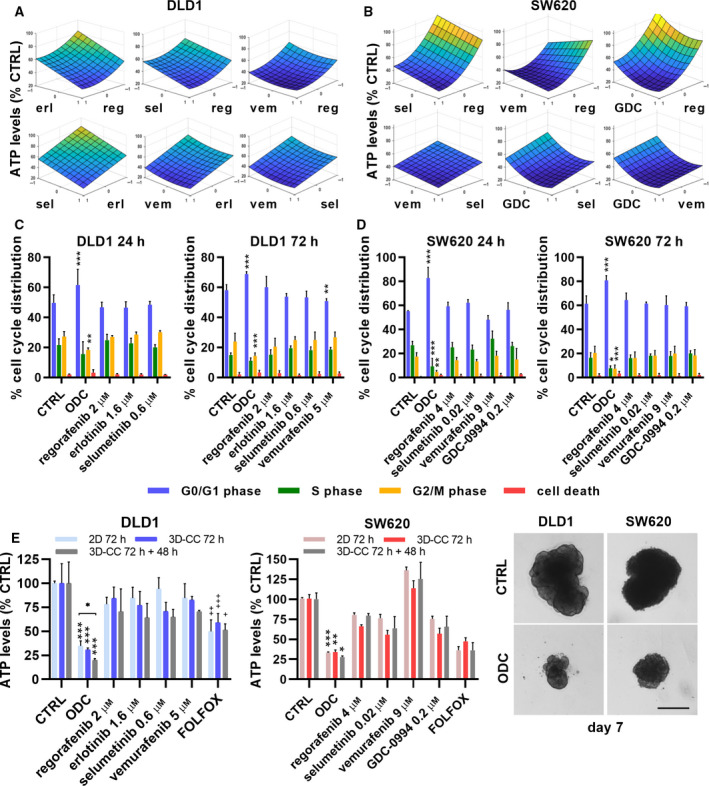
ODC response surfaces, cell cycle distribution, cell morphology, and heterotypic 3D cultures after ODCs treatment. Response surface contour plots in a. DLD1cells and b. in SW620 cells between all two‐drug options after treatment in Search 3 with the cell‐specific ODCs, fitted with the step‐wise second‐order linear regression model. The y‐axis represents drug efficacy (ATP levels, % CTRL), and the x‐axis represents the dose range (1, high dose, ED20; 0, low dose, ED10; −1, no drug) for each drug. Abbreviations: reg, regorafenib; erl, erlotinib; sel, selumetinib; vem, vemurafenib; GDC, GDC‐0994. Independent experiments conducted: N = 4 (DLD1 24h/72h), N = 3 (SW620 24h) and N‐4 (SW620 72h). Cell cycle distribution (G0/G1, S, G2/M phases or cell death) of c. DLD1 and d. SW620 cells after 24h (left graph) or 72h (right graph) post‐treatment with the ODCs, corresponding monotherapies or the CTRL (0.15% DMSO). e. Efficacy in cell metabolic activity (ATP levels, % CTRL) and representative images of heterotypic 3D co‐cultures (3D‐CCs) after (re)treatment for 72h (day 5) or 72h + 48h (day 7) with the cell‐specific ODCs, corresponding monotherapies or the CTRL (0.15% DMSO) of DLD1 and SW620 cells, respectively. 2D cultures were treated on day 1 postseeding. The heterotypic 3D‐CCs consisted of CRC cells in ratio 1 : 1 with healthy colon CCD841CoN fibroblasts and 5% human endothelial ECRF24 cells and were treated for 72 h starting on day 2. Error bars represent the SD of independent experiments conducted for 72h and 72h + 48 h, respectively, with N = 3 and 2 for DLD1 and N = 2 and 2 for SW620. Significance of *P < 0.05, **P < 0.01, and ***P < 0.001 represent the comparison with the CTRL and monotherapies (c,d,e), while + P < 0.05, ++ P < 0.01, and +++ P < 0.001 represent the comparison between the ODC‐treated and FOLFOX‐treated groups (e) or two‐way ANOVA with post hoc Dunnett’s multiple comparisons test (c,d). Scale bars represent 100 µm and 200 µm, in 2D and 3D, respectively.