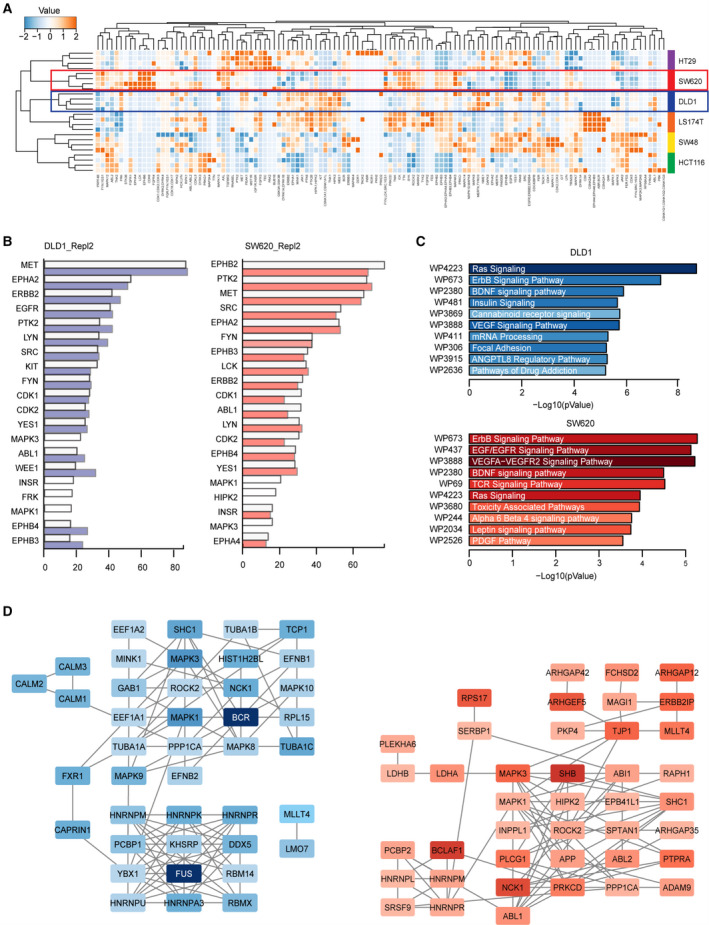
Fig. 6.

Phosphoproteomic profiling of CRC cell lines treated with ODCs. a. Heatmap and unsupervised clustering of phosphorylated kinases in six CRC cell lines (DLD1 in the blue frame, SW620 in the red frame) of N = 2 independent experiments. Color coding is based on normalized spectral counts measured, with relative expression scores per kinase depicted. b. Top 20 INKA scores in vehicle‐treated DLD1 (left) and SW620 (right) (white bars) with profiles after the indicated treatments superimposed in colored bars. c. Pathway enrichment analysis (WikiPathways) of downregulated phosphoproteins in DLD1 (N = 49) and SW620 (N = 59). The selection of phosphogenes was based on the sum of normalized spectral counts> 5 and fold change> 1.5 in both replicates. The top 10 functional clusters are sorted according to p‐value, and color intensity is proportional to the number of represented genes per pathway. d. Protein interaction analysis of downregulated phosphoproteins using STRING (string‐db.org). Nodes are color‐coded proportional to fold change. Left: DLD1, right: SW620 cells
