
Fig. 2.
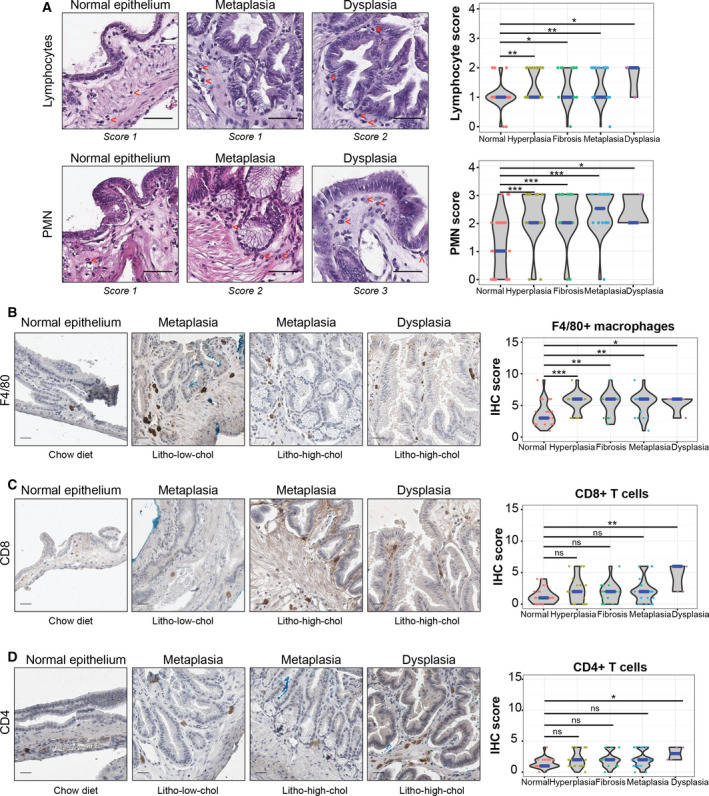
Leukocyte infiltration is higher in epithelial alterations than normal gallbladder epithelial samples. (A) Left: H&E‐stained gallbladder sections. Red arrows indicate lymphocytes and PMN cells (top and bottom panels, respectively) (scale bar, 50 µm). Right: Violin plots showing H&E scores for both cell types grouped by epithelial alterations (nsample = 34, 22, 20, 26, and 5 for normal epithelium, hyperplasia, fibrosis, metaplasia, and dysplasia; respectively). Lymphocytes and PMN infiltration are higher among altered epithelial samples than normal gallbladder epithelial samples. (B–D) Immunostaining (left) and IHC score (right) analysis of F4/80+ macrophages, CD8+ T cells, and CD4+ T cells (scale bar, 100 µm). In violin plots, the median is indicated in blue. Sample numbers for normal epithelium, hyperplasia, fibrosis, metaplasia, and dysplasia in each condition are as follows: 26, 17, 13, 20, and 5 for F4/80 + IHC score; 26, 20, 15, 23, and 5 for CD8+ IHC score; and 25, 19, 14, 22, and 4 for CD4+ IHC score, respectively. Multiple comparison analyses were performed with Kruskal–Wallis and Dunn's post hoctest. *P < 0.05, **P < 0.01, ***P < 0.001 and ns: not significant.