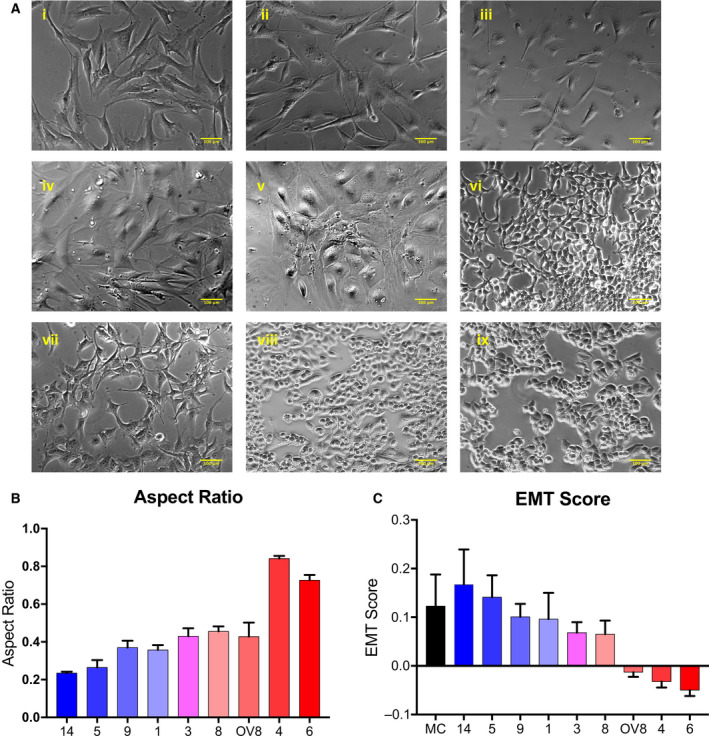
Fig. 1.

Epithelial/mesenchymal characterization of HGSOC cells. (A) Patient‐derived samples and OVCAR8 cell line (A, i–viii; i = PDX14, ii = PDX5, iii = PDX9, iv = PDX1, v = PDX3, vi = PDX8, vii = OVCAR8, viii = PDX4, ix = PDX6). Scale bar represents 100 μm. The passage numbers at which images were taken are 6, 9, 5, 3, 8, 8, 8, 9, and 11, respectively. Morphological analysis (B) was performed on three independent biological replicates (n = 3), where 1 = epithelial. (C) EMT score was calculated by RNA expression of mesenchymal and epithelial markers (three each; see Methods), demonstrates negative correlation with morphology and aspect ratio. MC, BJ1 fibroblast as mesenchymal control; EC, MCF10A as epithelial control. Independent biological replicates (n): PDX14 = 5, PDX5 = 4, PDX9 = 4, PDX1 = 5, PDX3 = 3, PDX8 = 4, OV8 = 4, PDX4 = 4, PDX6 = 4.
