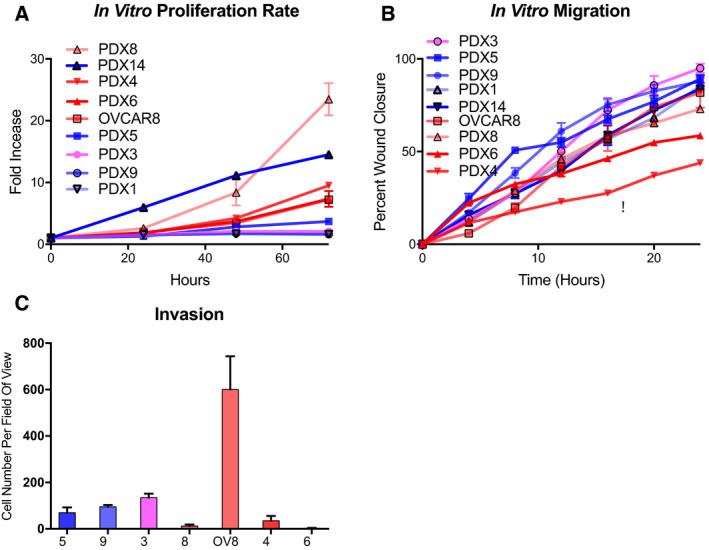
Fig. 2.

Proliferation, migration, and invasion of HGSOC cells. Doubling time (A), migration (B), and invasion assay (C) performed via MTT, wound healing assay, and Matrigel invasion assay, respectively. Independent biological replicates; PDX5 (n = 5), PDX9 (n = 3), PDX1 (n = 4), PDX3 (n = 3), PDX8 (n = 3), OV8 (n = 3), PDX4 (n = 3), and PDX6 (n = 3). Migration is represented in technical replicates that have been performed in biological triplicates. Invasion is represented by independent biological replicates (n = 3). Samples are labeled from top to bottom in order of decreasing growth rate and migration. OV8 = OVCAR8 cell line. Error bars represent standard error of the mean (SEM).
