
Fig. 4.
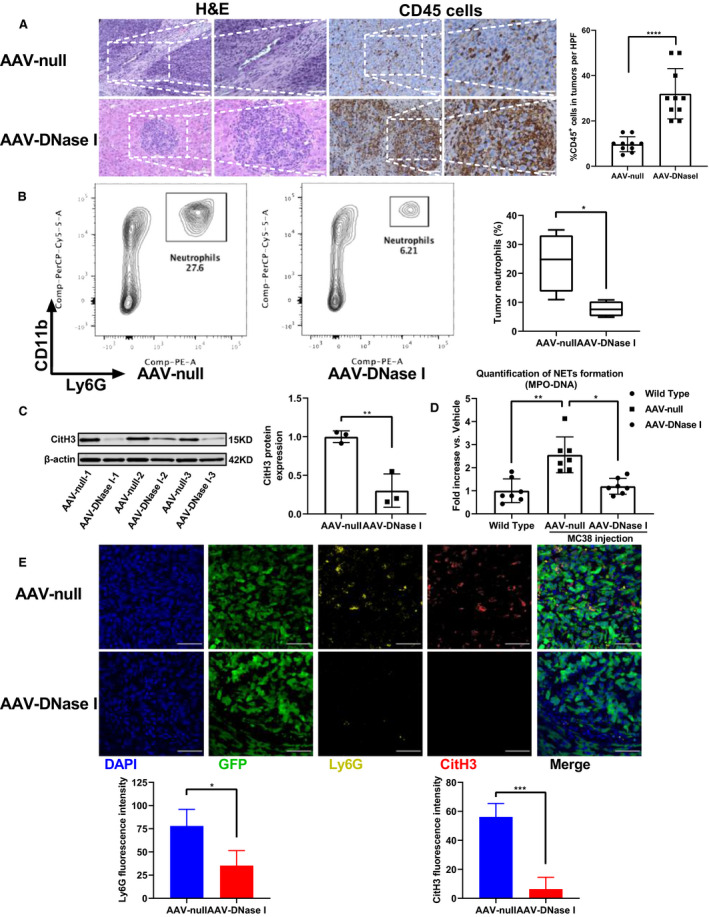
AAV‐mediated DNase I reduces neutrophil recruitment and inhibits NET formation in CRC liver metastasis and in circulation. (A) Representative images of H&E staining and immunohistochemical labeling for CD45 in the section exhibit increased immune cells in mice with AAV‐DNase I treatment compared with AAV‐null treated group. Quantification of CD45‐positive staining is expressed as a percentage average in the 10 fields. Magnification, ×200; magnified, ×400. Scale bar = 50 μm. n = 4 mice/group. Data were analyzed by Mann–Whitney U‐test. (B) Flow cytometry of tumor tissue showing neutrophils infiltration. n = 4 mice/group. Data were analyzed by Student's t‐test. (C and D) The expression of CitH3 by western blot analysis and quantification of serum MPO‐DNA by ELISA were assessed at 21 days. n = 3–7 mice/group. Data were analyzed by Student's t‐test and Kruskal–Wallis test. (E) Immunofluorescent staining of tumor tissue shows NET formation 21 days after tumor cell injection in AAV‐DNase I and AAV‐null treated mice. Nucleus, blue; tumor cells labeled with GFP, green; Ly6G, yellow; CitH3, red. Magnification, ×60. Scale bar = 50μm. Quantification of Ly6G positive or CitH3‐positive fluorescence intensity. n = 4 mice/group. Data were analyzed by Student's t‐test. All data represent mean ± SD, *P < 0.05, **P < 0.01, ***P < 0.001, ****P < 0.0001.