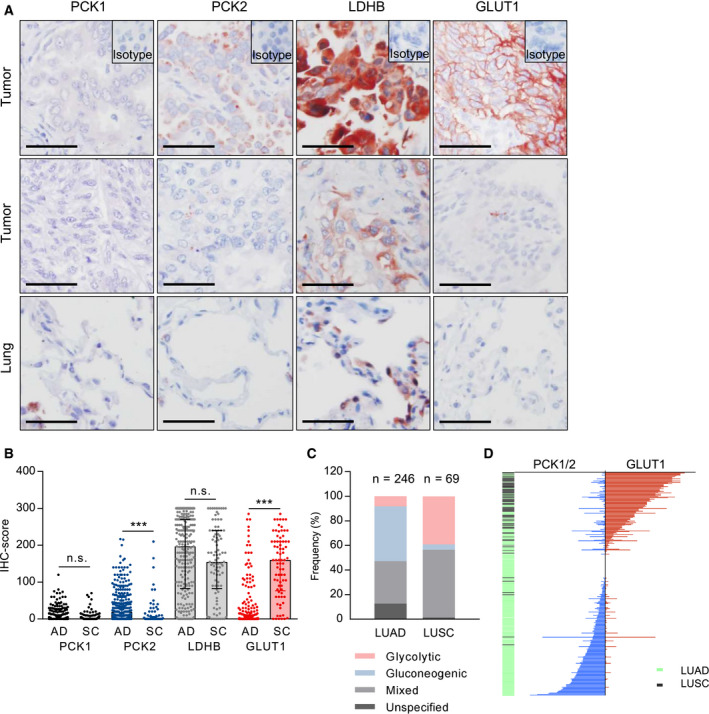
Fig. 1.

Glycolysis and gluconeogenesis markers in NSCLC and differences according to histology and tumor size. (A) Examples of strong or moderate (1st row) versus weak/negative IHC staining (2nd row) for PCK1, PCK2, LDHB, and GLUT1 in tumors and normal lung tissue (3rd row). Scale bar = 50 µm. (B) Comparison of IHC scores in adenocarcinoma (AD) and squamous cell carcinoma (SC). Group comparisons were performed with the Mann–Whitney U‐test in LUAD and LUSC patients with evaluable PCK1 (n = 258/85), PCK2 (n = 264/94), LDHB (n = 257/92), and GLUT1 staining (n = 276/77). *** P < 0.001. (C) Frequency of glycolytic (GLUT1 positive, PCK1/2 negative), gluconeogenic (GLUT1 negative, PCK1 or PCK2 positive), and mixed phenotypes (GLUT1 positive and PCK1 or PCK2 positive). Samples without immunopositivity for either PCK1, PCK2, or GLUT1 were defined as 'unspecified'. LUAD, lung adenocarcinoma; LUSC, lung squamous cell carcinoma. (D) Waterfall plot visualizing combined PCK1/2 IHC scores and GLUT1 scores in a total of 317 NSCLC patients.
