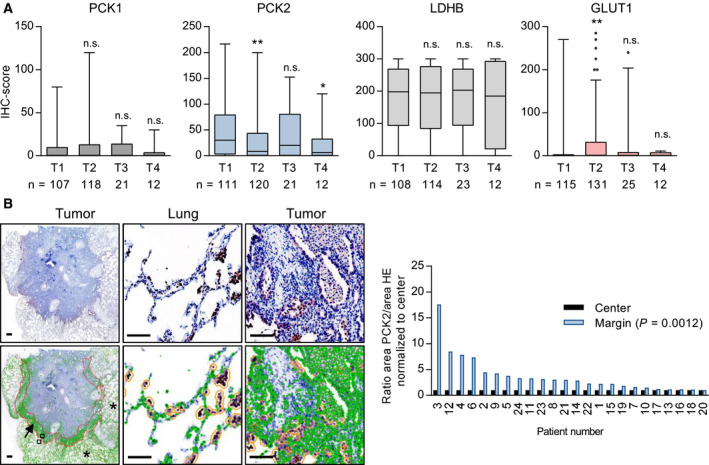
Fig. 2.

Intratumoral heterogeneity in gluconeogenesis gene expression and relation to tumor size. (A) Differences in glycolysis and gluconeogenesis gene expression according to T stage *P < 0.05, **P < 0.01 on Mann–Whitney U‐test versus T1. n.s., not significant; (B) Expression intensity of PCK2 as compared between tumor margin (arrow) and center. Normal lung tissue is indicated with asterisks. Scale bar = 100 µm. Strongly stained macrophages (orange circles) were automatically excluded by setting an appropriate cutoff value. Right: Results of automated analysis by means of the cellprofiler software.
