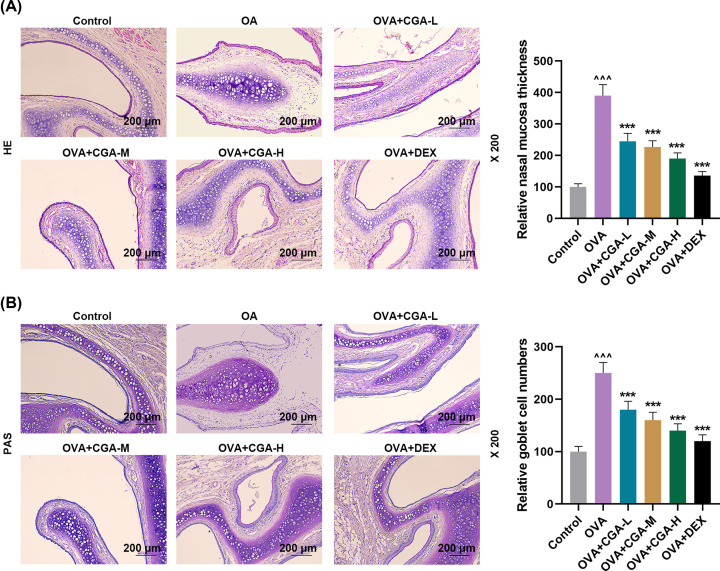
Figure 2. CGA reduced histopathological abnormalities and goblet cell number in nasal mucosa of AR mice.
(A) Representative photos of histopathological changes of nasal mucosal thickness of mice with AR, treated with different concentrations (low, medium, and high) of CGA or Dex, reflected by Hematoxylin–Eosin staining (magnitude: 200×; scale: 200 μm); the semi-quantative analysis of the images is also shown on the right. (B) Representative photos of goblet cells in nasal mucosal thickness of mice with AR, treated with different concentrations (low, medium, and high) of CGA or Dex, reflected by PAS staining (magnitude: 200×; scale: 200 μm); the semi-quantative analysis of the images is also shown on the right. ∧∧∧P or ***P<0.001; ∧ vs. Control; * vs. OVA (L, low concentration of CGA; M, medium concentration of CGA; H, high concentration of CGA). ∧∧∧P or ***P<0.001; ∧ vs. Control; * vs. OVA.

