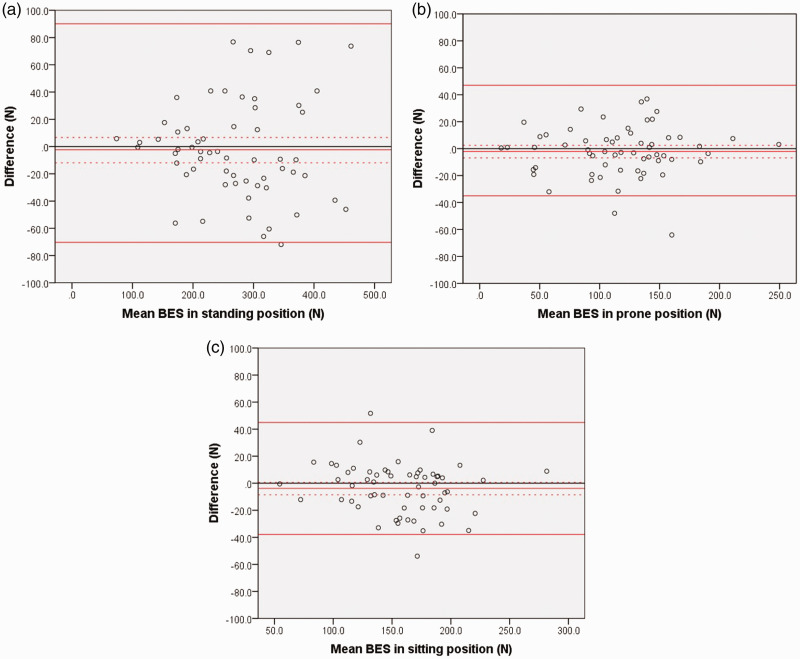
Figure 3.
Bland–Altman plots of back extensor strength (BES) data in healthy adults (n = 60), tested in: (a) standing; (b) prone; and (c) sitting positions. Plots illustrate mean bias (middle solid red line), the upper and lower limits of 95% confidence interval for measurement errors (red upper and lower dashed lines), and limits of agreement (red upper and lower solid lines) between two separate measurement sessions.

