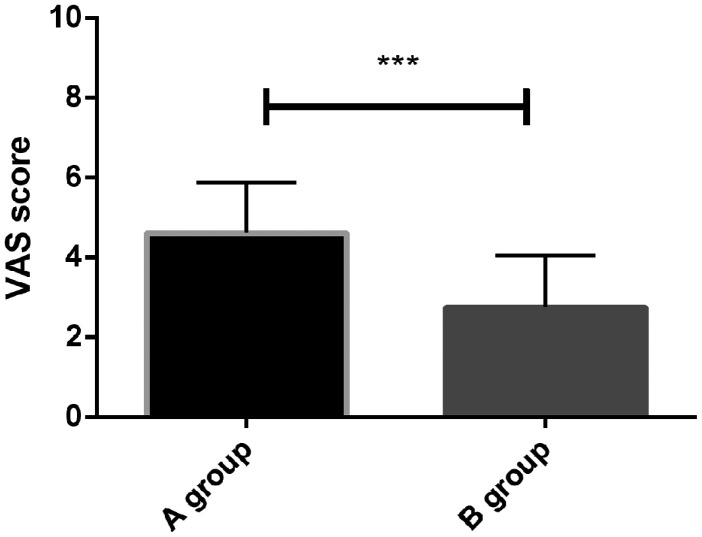
Figure 3.
Comparison of VAS scores between the two treatment groups.
The VAS scores of patients in group A were significantly higher than those of patients in group B at 1 week after endodontic treatment (P < 0.05). *indicates differences between the two groups (***P < 0.001). VAS, visual analogue scale.

