
Figure 6.
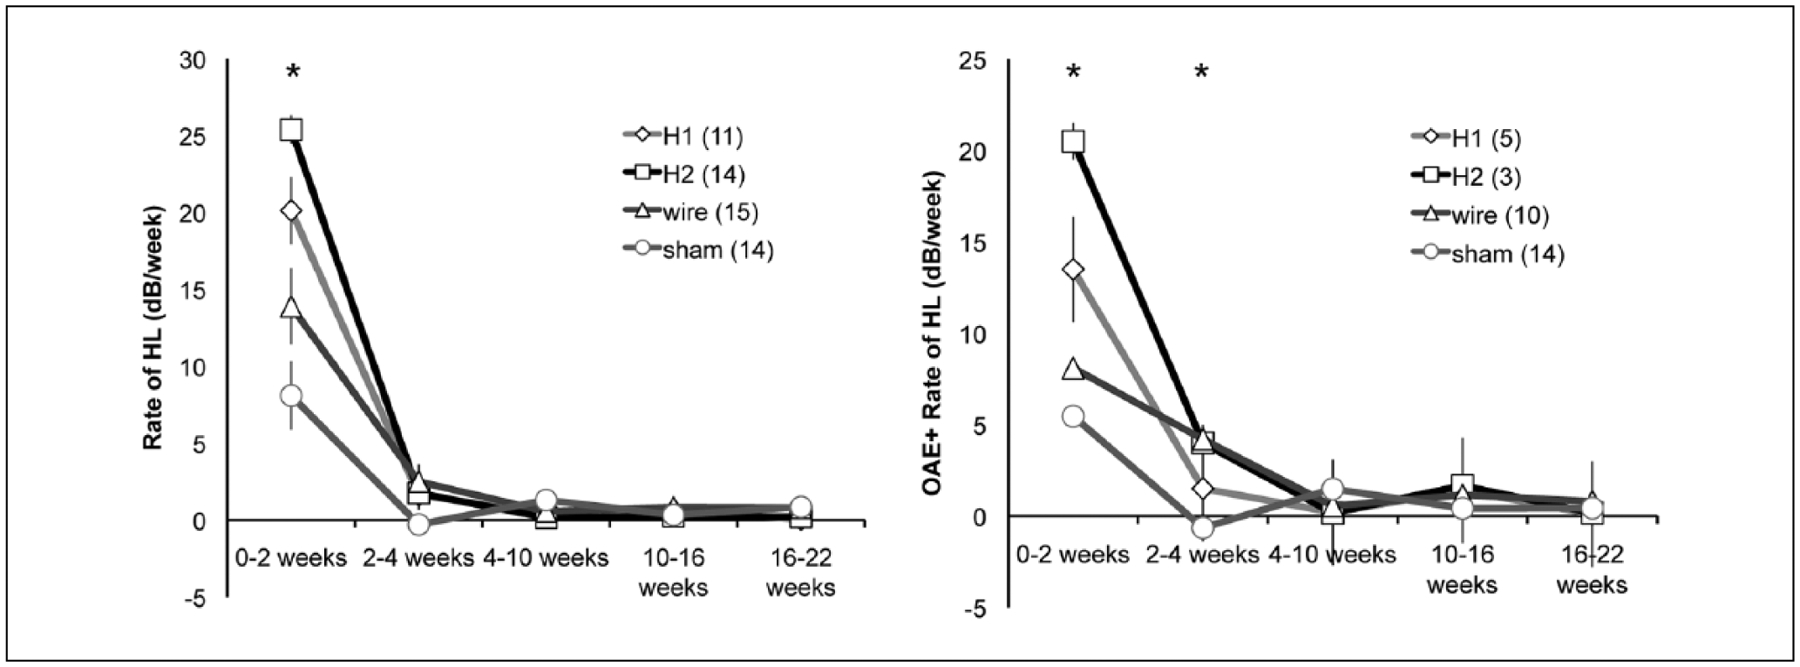
Rate of hearing loss (dB/wk) is depicted across serial intervals for (A) all subjects and (B) only those subjects that retained distortion product otoacoustic emissions (DPOAEs) after implant insertion. Numbers per subject group are shown in the figure legends. Rate of hearing loss differed between groups after insertion (0–2 weeks) but was nearly identical subsequently. When only DPOAE-positive animals were included, Silastic 2 and wire conditions had small but significant differences in rate of hearing loss at 2 to 4 weeks from the Silastic 1 and sham conditions (Silastic 1, 1.5; Silastic 2, 4; wire, 4.2; sham, −0.6 dB/wk, P < .003).