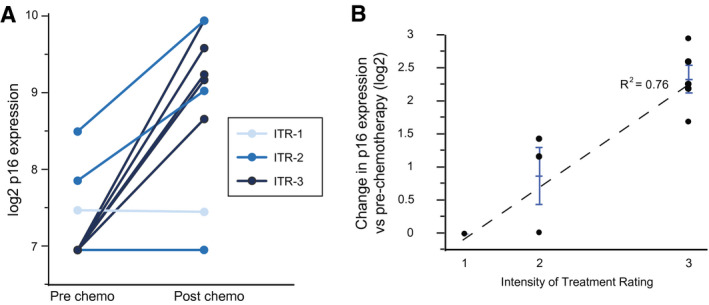
Figure 4.

Expression levels of p16INK4a are compared between matched pretreatment and posttreatment specimens from children and adolescents who were treated for a first cancer. (A) Changes in p16 expression in the current prospective cohort are categorized according to the intensity of treatment regimen (Intensity of Treatment Rating [ITR] Scale scores are indicated from 1 [lowest] to 4 [highest]). (B) Changes in p16 expression from pretreatment to posttreatment are strongly correlated with intensity of the chemotherapy regimen. Error bars represent standard error of the mean.
