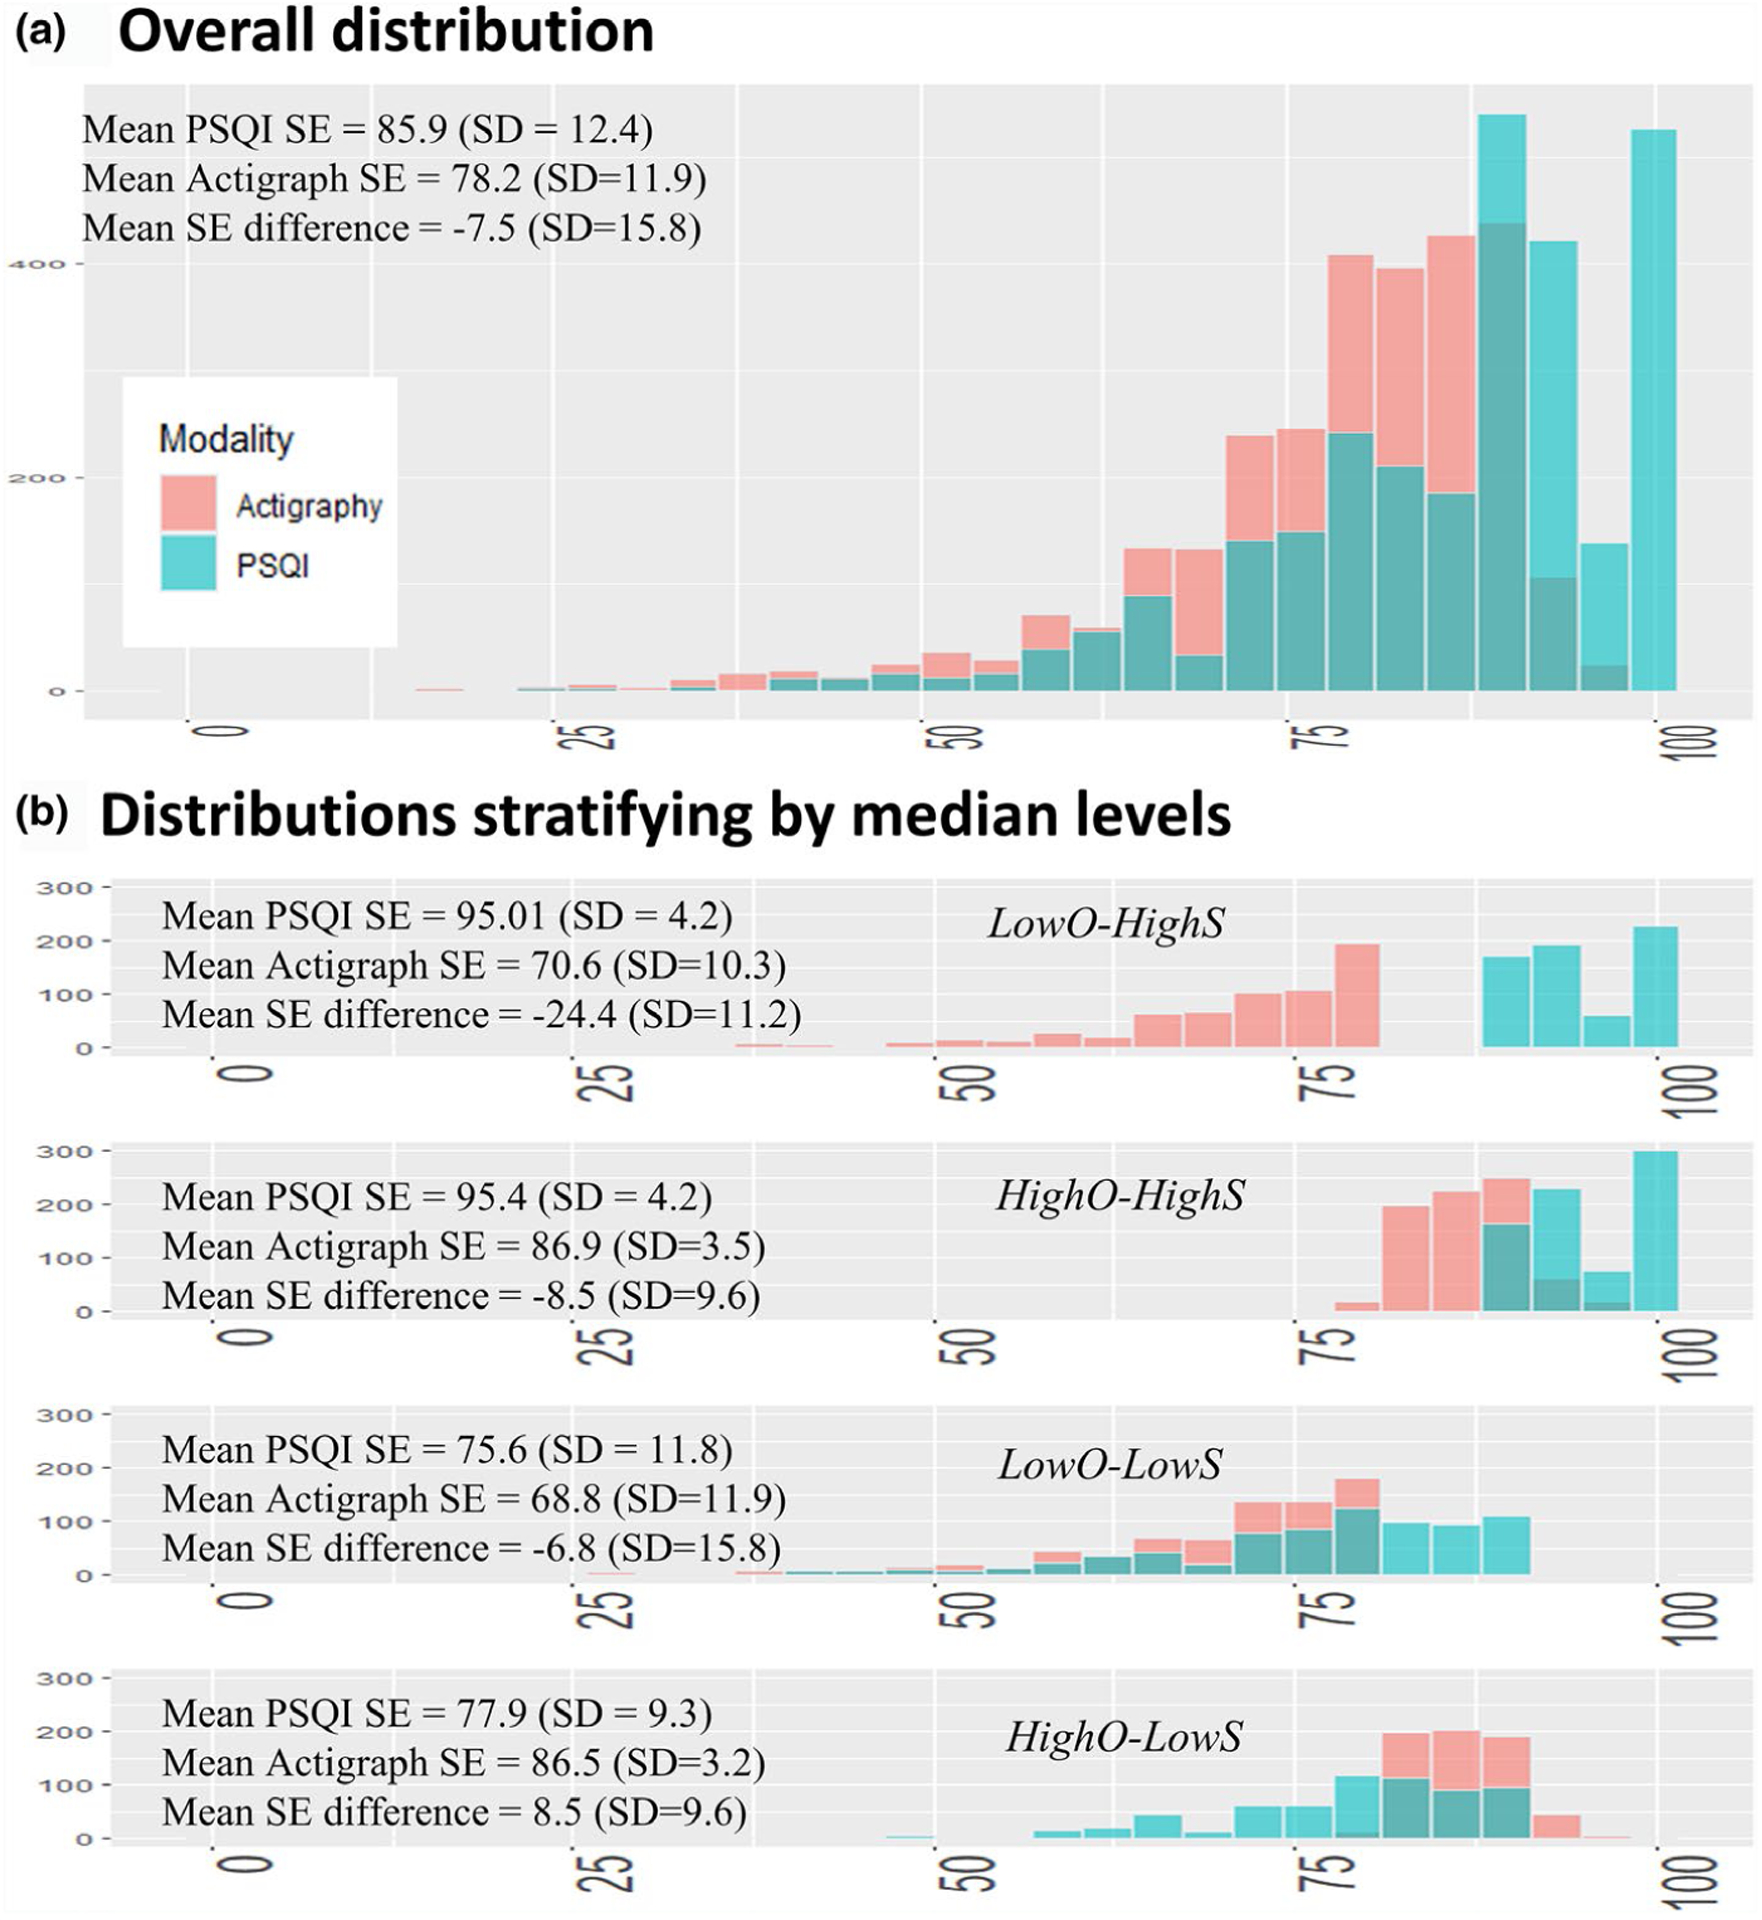
FIGURE 1.

Descriptive information showing the four groups with distinct sleep efficiency (SE) and discrepancy values. As opposed to a simple subtraction of the two SE measures, stratifying by median values of SE measures and creating four groups isolates the effect of SE levels and discrepancy. PSQI, Pittsburgh Sleep Quality Index
