
FIGURE 3.
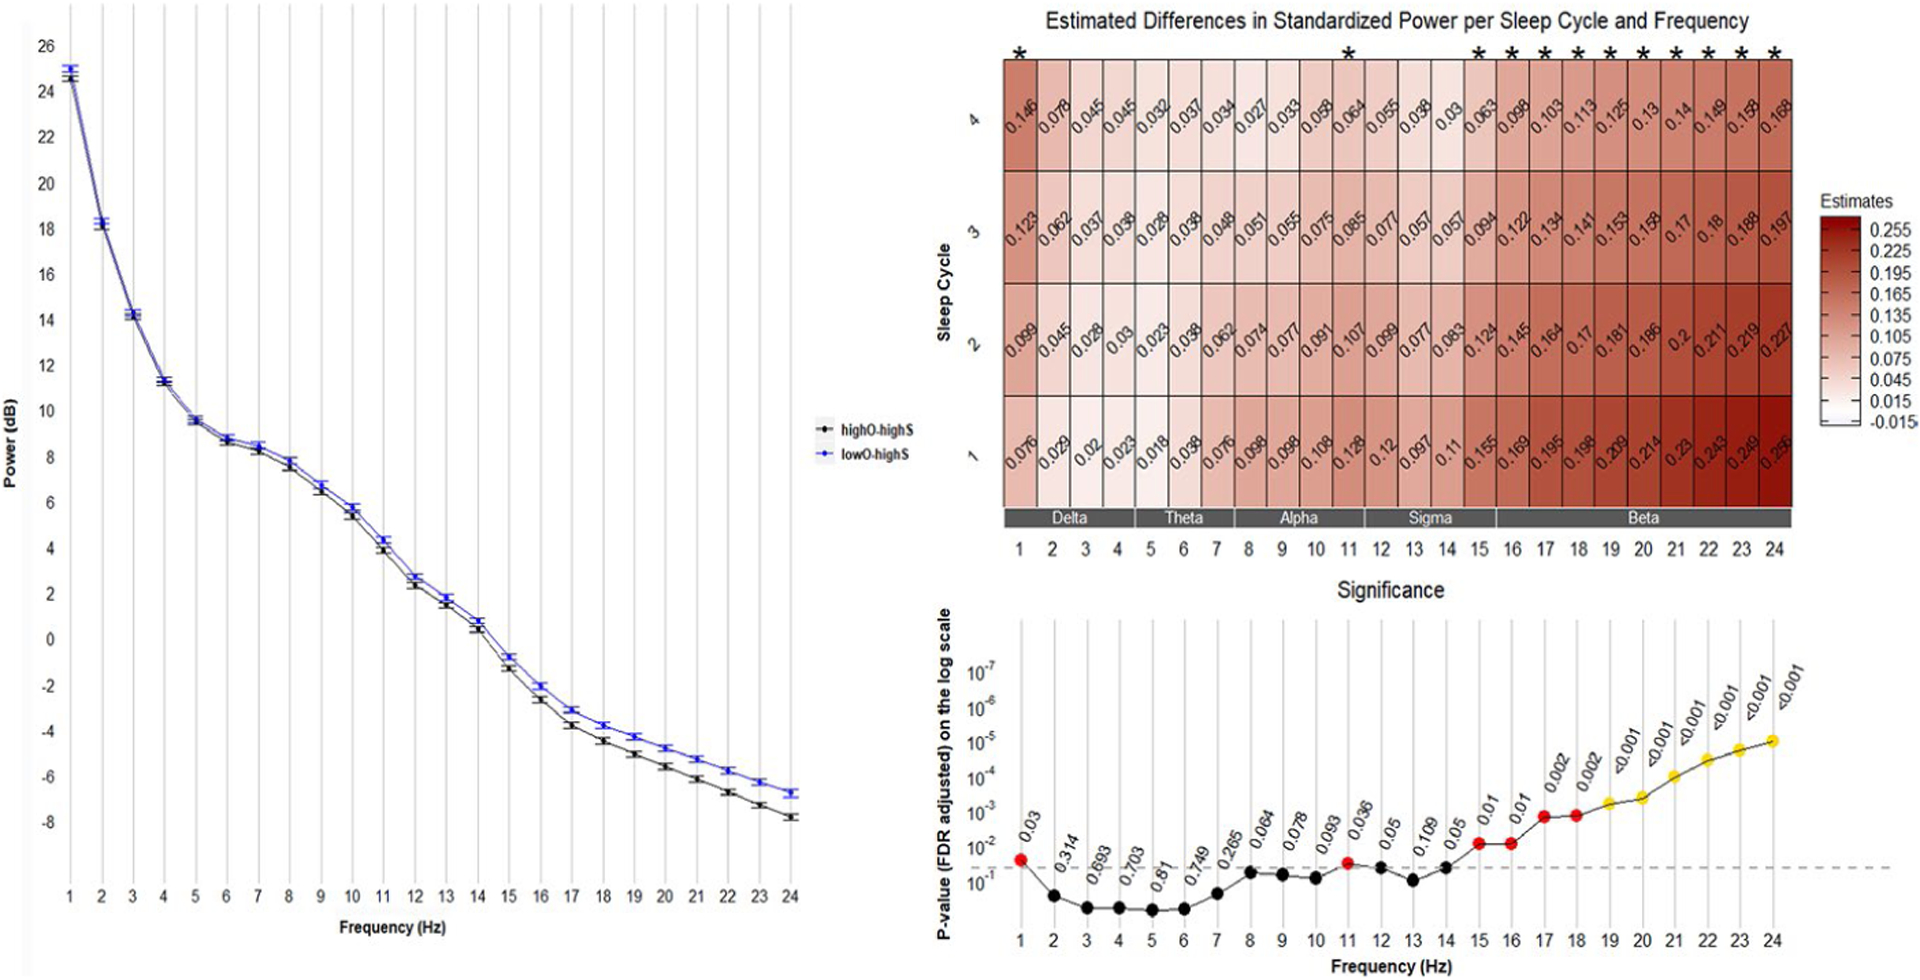
Comparisons between LowO-HighS and HighO-HighS groups. Left: mean (± standard error) of power averaged over four sleep cycles. Right: frequency-specific and sleep cycle-specific differences in standardized power comparing LowO-HighS with HighO-HighS. p-values were adjusted for multiple comparisons (72 comparisons from 24 frequency bins and 3 sleep efficiency groups) using the Benjamini & Hochberg method. Positive estimates indicate higher power in the LowO-HighS group than in the HighO-HighS group. FDR, False Discovery Rate