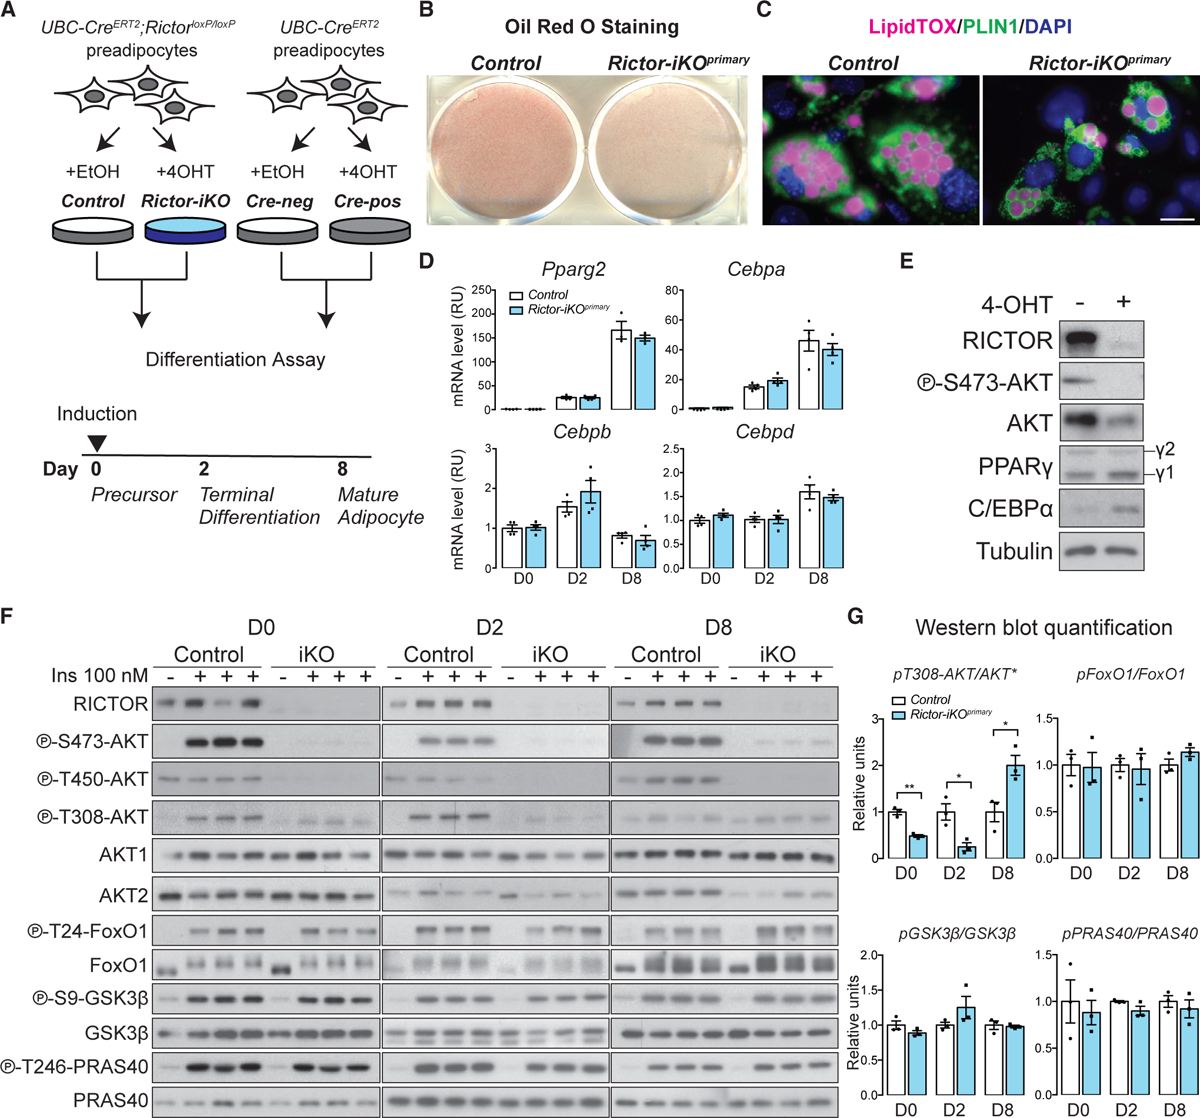
Figure 1. mTORC2 Promotes Lipid Filling during Subcutaneous White Adipogenesis In Vitro.

(A) Model of in vitro experimental strategy. 4-OHT, 4-hydroxytamoxifen; Cre-neg, Cre-negative cells; Cre-pos, Cre-positive cells.
(B) Oil red O (ORO) staining of differentiated (day 8) isogenic control and Rictor-iKO primary (Rictor-iKOprimary) cells.
(C) LipidTOX and Perilipin 1 (PLIN1) immunofluorescence staining of differentiated (day 8) control and Rictor-iKOprimary cells. Scale bar, 100 μm.
(D) Relative mRNA expression by RT-PCR of differentiation marker genes at the indicated differentiation days (n = 4; data represent mean ± SEM).
(E) Western blot of lysates from differentiated (day 8) cells. γ1, PPARγ1 isoform, γ2, PPARγ2.
(F) Western blot of the indicated total and phospho-proteins in lysates with or without 100 nM insulin (ins) stimulation at days 0, 2, and 8 of differentiation.
(G) Quantification of the indicated total and phosphorylated protein levels. Total AKT (asterisk) reflects AKT1 and AKT2 levels (n = 3; data represent mean ± SEM; *p < 0.05 and **p < 0.01).
