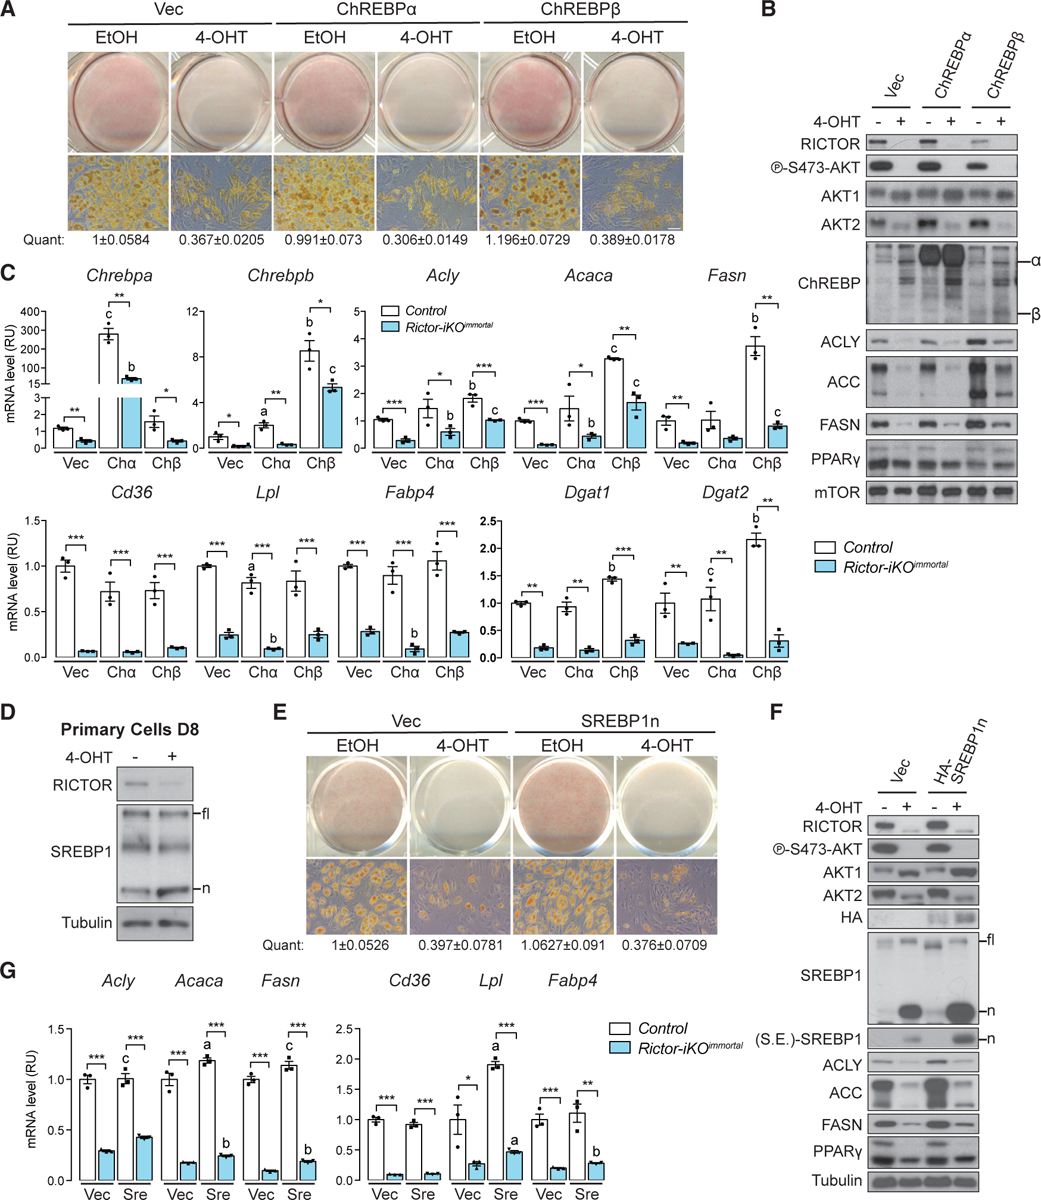
Figure 4. Overexpressing ChREBPβ or SREBP1n Does Not Rescue Rictor Loss.

(A) Oil red O (ORO) staining of differentiated control (EtOH) and Rictor-iKOimmortal (4-OHT) cells expressing empty vector (Vec), ChREBPα, or ChREBPβ. The number below represents quantification (quant) of oil red O after isopropanol extraction (scale bar, 50 μm; data represent mean ± SEM).
(B) Western blot of lysates corresponding to (A).
(C) Relative mRNA expression by RT-PCR of the indicated genes corresponding to (A) (n = 3; data represent mean ± SEM; *p < 0.05, **p < 0.01, and ***p < 0.001). a–c denote comparison of overexpressing cells to vector-containing cells: a, p < 0.05; b, p < 0.01; c, p < 0.001.
(D) Western blot of lysates from differentiated (D8) control and Rictor-iKOprimary cells. fl, full-length SREBP1; n, processed nuclear SREBP1 product.
(E) Oil red O (ORO) staining of differentiated control and Rictor-iKOimmortal cells expressing empty vector (Vec) or SREBP1n. The number below represents quantification (quant) of oil red O after isopropanol extraction (data represent mean ± SEM).
(F) Western blot of lysates from differentiated control and Rictor-iKOimmortal cells corresponding to (E). S.E., shorter exposure.
(G) Relative mRNA expression by RT-PCR of indicated genes in control and Rictor-iKOimmortal cells corresponding to (E) (n = 3; data represent mean ± SEM; *p < 0.05, **p < 0.01, and ***p < 0.001). a–c denote comparison of overexpressing cells to vector-containing cells: a, p < 0.05; b, p < 0.01; c, p < 0.001.
