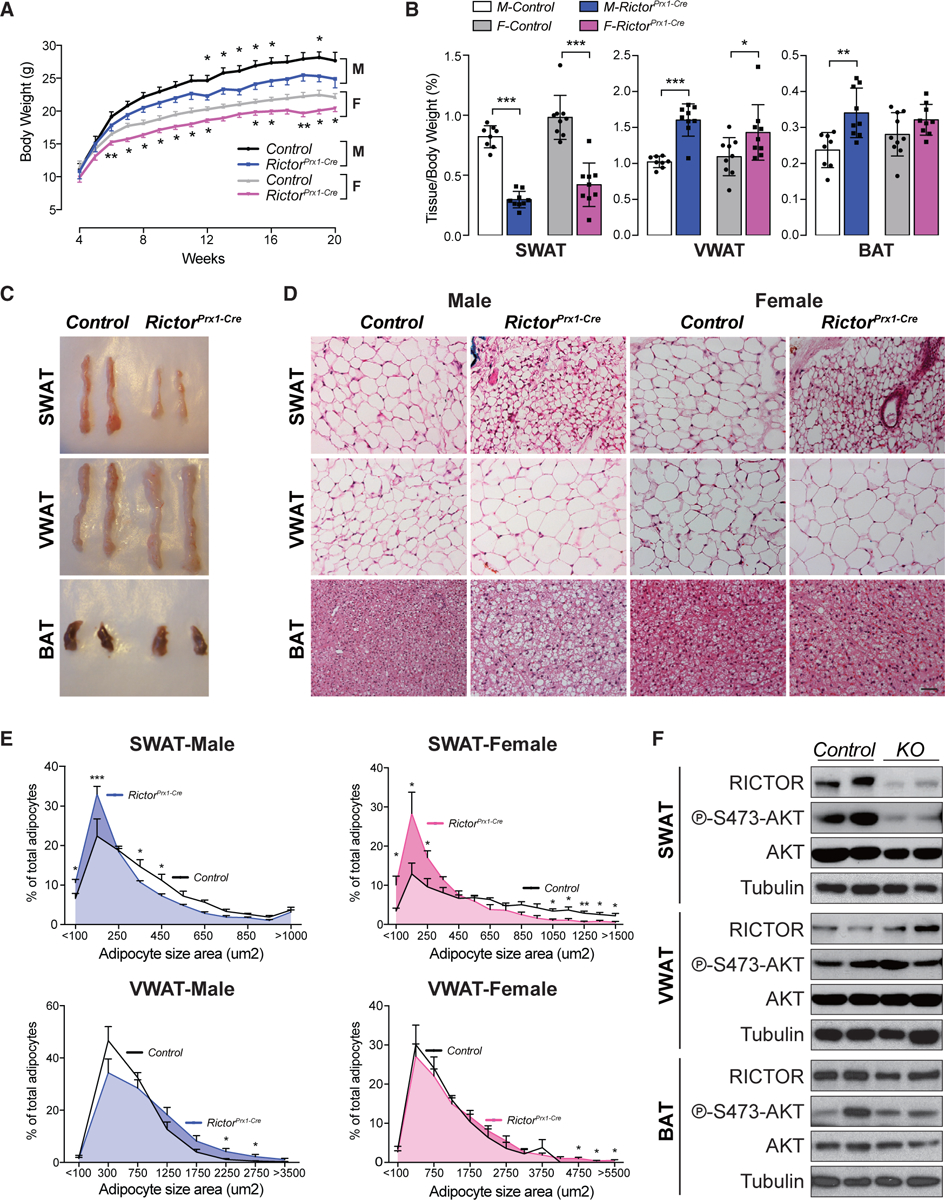
Figure 6. Subcutaneous White Adipose Tissue Growth Requires mTORC2 In Vivo.

(A) Growth curves of male (M) and female (F) control and RictorPrx1-Cre mice (n = 10–14; data represent mean ± SEM; t test; *p < 0.05).
(B) Tissue weight relative to body weight of subcutaneous white adipose tissue (SWAT), visceral white adipose tissue (VWAT), and brown adipose tissue (BAT) (n = 8–10; data represent mean ± SEM; *p < 0.05, **p < 0.01, and ***p < 0.001).
(C) Representative images of the indicated fat depots from 8-week-old male control and RictorPrx1-Cre mice.
(D) H&E stains corresponding to the tissues in (C) for both male and female mice (scale bar, 100 μm).
(E) Individual adipocyte cell size distribution in each indicated depot (n = 4 mice; >1,000 and 500–1,000 individual adipocytes measured from SWAT and VWAT of each mouse, respectively; data represent mean ± SEM; *p < 0.05, **p < 0.01, and ***p < 0.001).
(F) Representative western blot of lysates from SWAT, VWAT, and BAT of 8-week-old male control and RictorPrx1-Cre mice.
