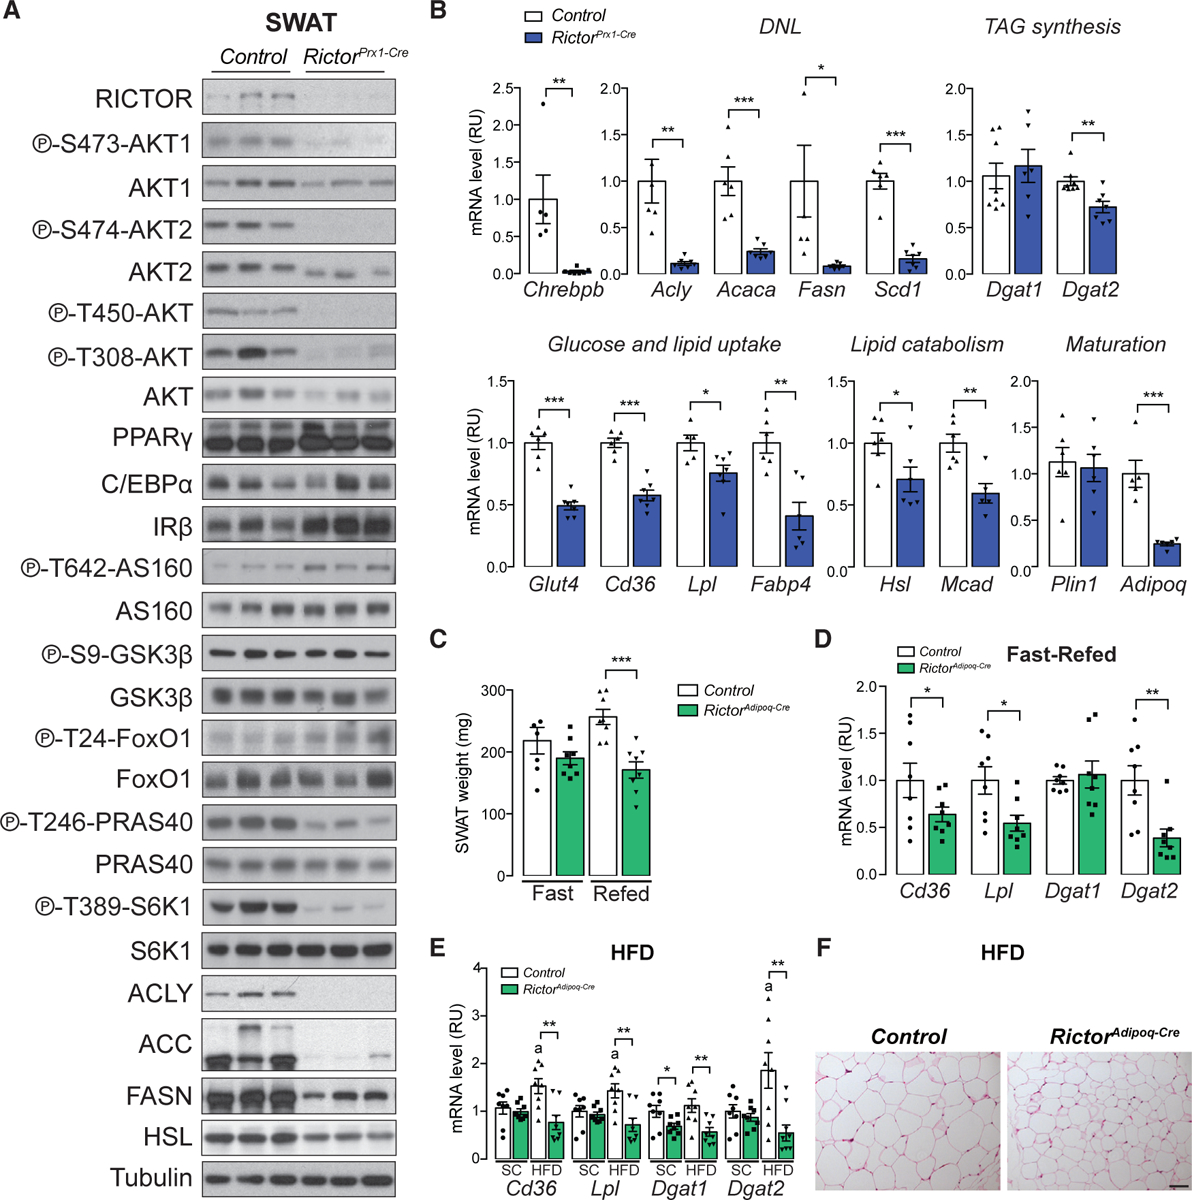
Figure 7. Rictor Regulates Expression of Lipid-Handling Genes during SWAT Growth.

(A) Western blot of lysates from the subcutaneous white adipose tissue (SWAT) of 8-week-old control and RictorPrx1-Cre mice.
(B) Relative mRNA expression by RT-PCR of indicated genes from SWAT of 8-week-old control and RictorPrx1-Cre mice (n = 6–8; data represent mean ± SEM; *p < 0.05, **p < 0.01, and ***p < 0.001).
(C) Tissue weight of SWAT of 8-week-old control and RictorAdipoq-Cre mice refed for 6 h following 24 h fasting (n = 8; data represent mean ± SEM; ***p < 0.001).
(D) Relative mRNA expression by RT-PCR of indicated genes from SWAT of 8-week-old control and RictorAdipoq-Cre mice refed for 6 h following 24 h fasting (n = 8; data represent mean ± SEM; *p < 0.05, **p < 0.01, and ***p < 0.001).
(E) Relative mRNA expression by RT-PCR of indicated genes from SWAT of control and RictorAdipoq-Cre mice after 12 week HFD or standard chow (SC) feeding (n = 7 or 8; data represent mean ± SEM; *p < 0.05 and **p < 0.01; a, p < 0.05 when HFD samples were compared with SC samples).
(F) H&E stains of SWAT from control and RictorAdipoq-Cre mice after 12 week HFD or chow (SC) feeding (scale bar, 100 μm).
