Figure 1:
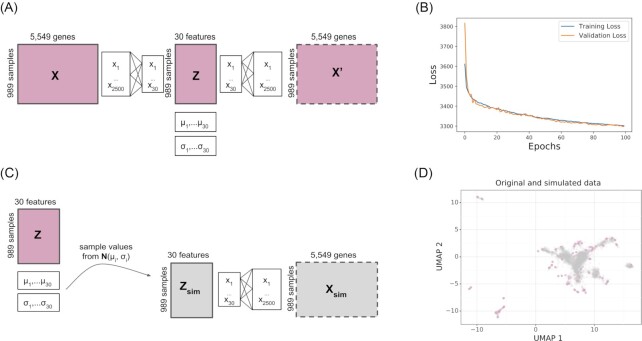
Simulating gene expression data using VAE. (A) Architecture of the VAE, where the input data get compressed into an intermediate layer of 2,500 features and then into a hidden layer of 30 latent features. Each latent feature follows a normal distribution with mean µ and variance σ. The input dimensions of the P. aeruginosa dataset are shown here as an example (989 samples, 5,549 genes). The same architecture is used to train the recount2 dataset except the input has 896 samples and 58,037 genes. (B) Validation loss plotted per epoch during training using the P. aeruginosa compendium. (C) Workflow to simulate gene expression samples from a compendium model, where new samples are generated by sampling from the latent space distribution. (D) UMAP projection of P. aeruginosa gene expression data from the real dataset (pink) and the simulated compendium using the workflow in C (grey).

