
Figure 4:
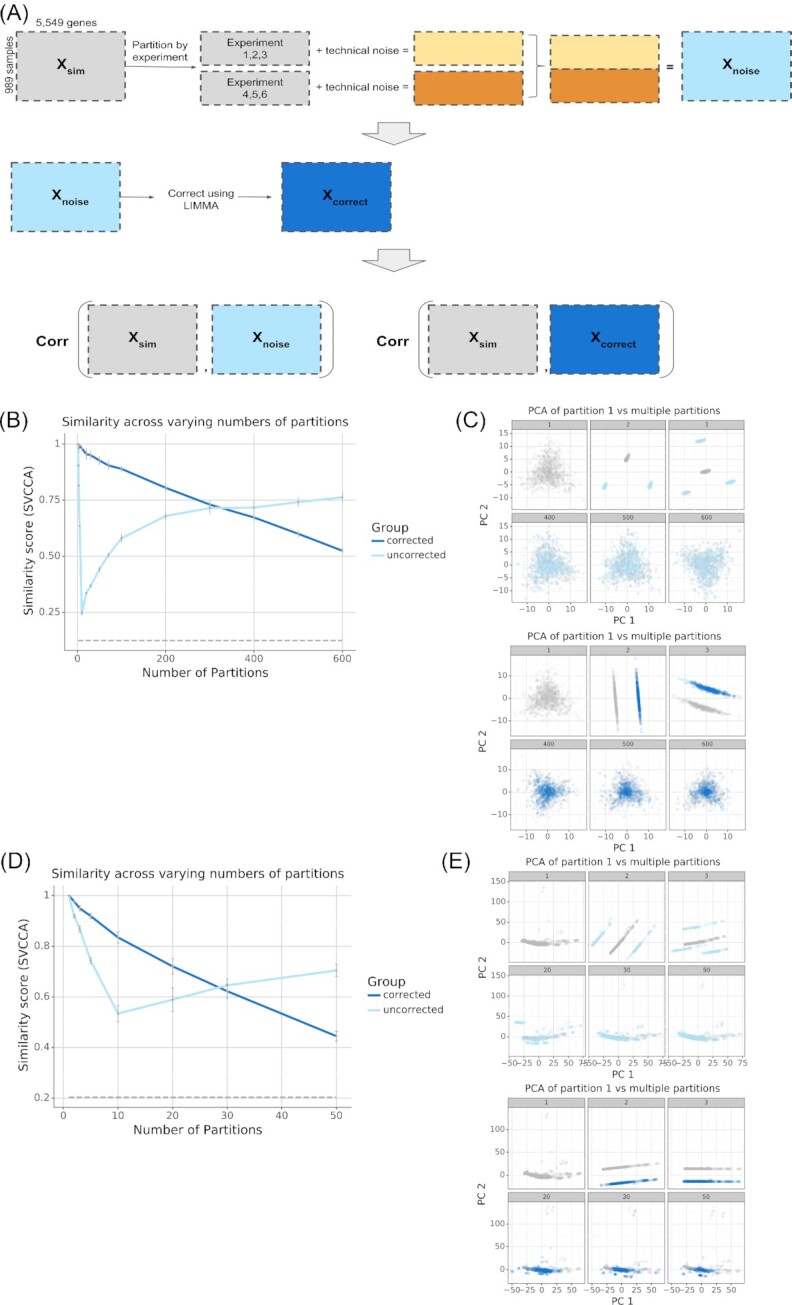
Results of simulating compendia composed of gene expression experiments. (A) Workflow describing how experiment-specific noise was added to the simulated compendia and how the noisy simulated compendia were evaluated for similarity compared to the unpartitioned simulated compendia. (B, D) SVCCA curve measuring the similarity between a compendium without noise vs a compendium with noise (light blue), and compendium with noise corrected for (dark blue). As a negative control, we used the similarity between the gene expression pattern of the compendium without noise with a permuted compendium, where the genes were shuffled (dashed grey line) to destroy any meaningful structure in the data. (C, E) Subsampled gene expression data (500 samples per compendium) projected onto the first 2 principal components showing the overlap in structure between the compendium without noise (gray) vs the compendium with noise (light blue), and compendium with noise corrected for (dark blue). PCA: principal component analysis.