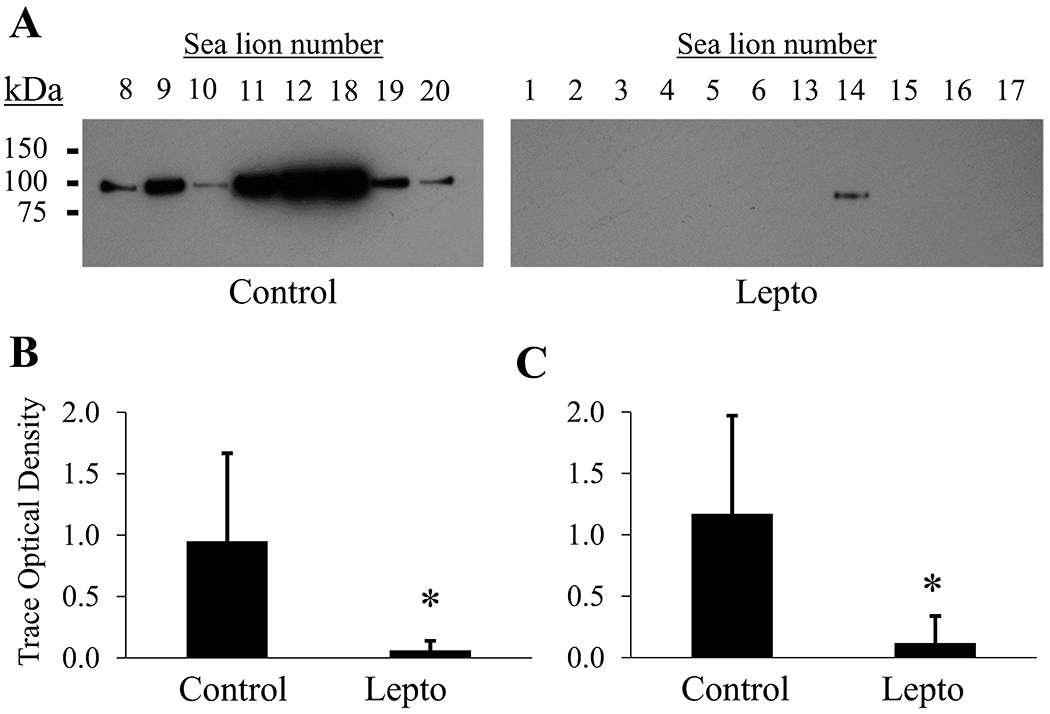
Figure 5.

Confirmatory Western blot for a decrease in urinary Neprilysin (HGNC gene symbol MME) abundance found by proteomics. (A) Equal protein (3 μg) was loaded per lane. Immunoreactivity was detected as a single band between 75 kDa and 100 kDa. Only the blot for equal protein loading is displayed. Secondary antibody alone control blots were negative. Images were cropped and contrast modified for display purposes. (B) Semiquantitative comparison of urinary neprilysin immunoreactivity by densitometry normalized to total urine protein. (C) Semiquantitative comparison of urinary neprilysin immunoreactivity by densitometry normalized to total urine volume (5 μL) loaded per lane. Asterisks indicate p < 0.01, Mann–Whitney U test. Error bars represent ± standard deviation.
