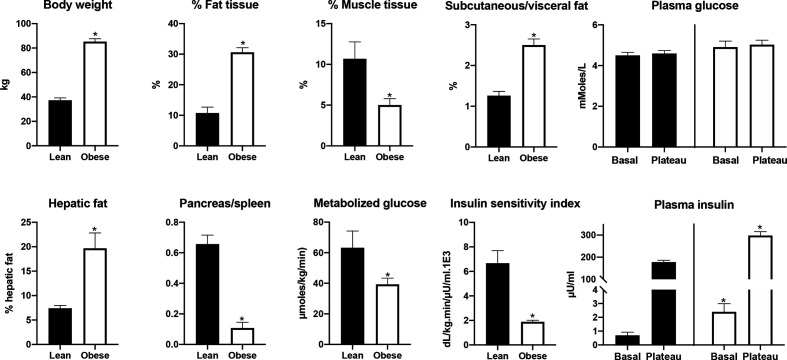
Figure 1.
Differences in phenotypic and metabolic features between the lean and obese groups. Note the absence of hyperglycemia in the obese while the fasting insulin is already elevated. Fat and muscle tissue percentage and the ratio between subcutaneous and visceral fat were quantified using a CT image of the abdomen. Hepatic fat was calculated from the ratio of X-ray attenuation between the liver and the spleen. Fat infiltration in the pancreas was estimated using the same method, but in the absence of a published correlation is presented only as ratio between the two attenuations. Metabolized glucose and insulin sensitivity were calculated from the clamp data. *Indicates a significant difference at p<0.05 between groups.

