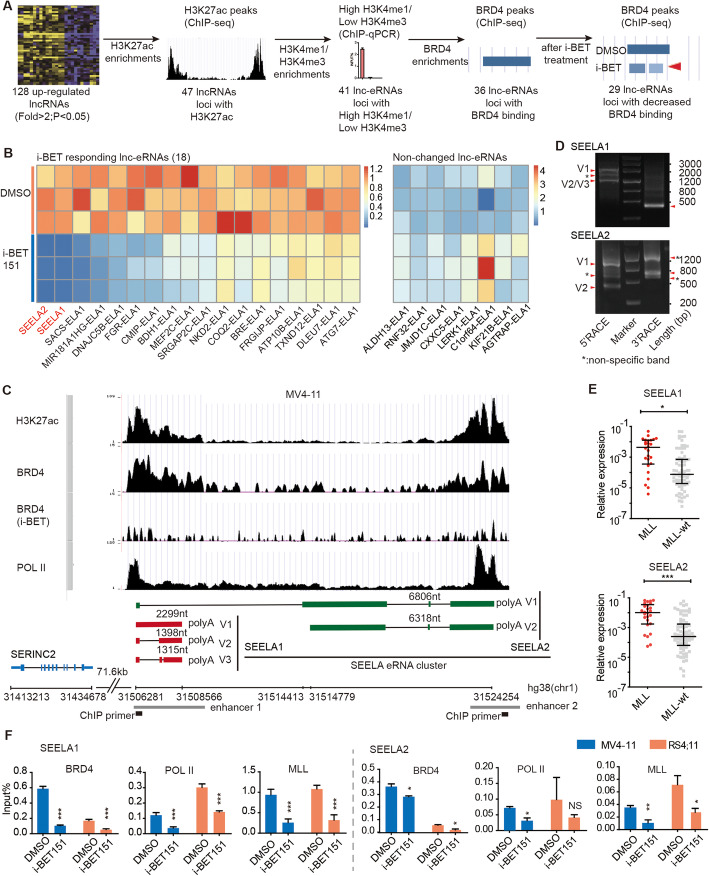
Fig. 1.
A set of lncRNAs are identified as lnc-eRNAs and are activated through abnormal enhancer transcription. a Analysis of the gene loci of 128 upregulated lncRNAs with H3K27ac, H3K4me1, H3K4me3 and BRD4 enrichment. b Heatmaps of the qPCR assay results showed the expression levels of lnc-eRNAs in MV4-11 cells treated with i-BET151. Eighteen lnc-eRNAs were downregulated, 8 lnc-eRNAs were unchanged, and 3 lnc-eRNAs were not detected in three independent experiments. c The epigenetic environment of SEELA and its genomic relationship with SERINC2. SEELA is located 71.6 kb downstream of SERINC2, and its gene locus is marked by H3K27ac, BRD4 and POL II in two enhancer regions (as shown in schematic diagrams (gray)). The ChIP-qPCR primers were designed to target the gene body of SEELA (black). d DNA agarose gels showing that there were three and two variants of SEELA1 and SEELA2, respectively, according to the results of 5′ and 3′ RACE assays. *Nonspecific band. e The expression of SEELA was significantly upregulated in patients with MLL leukemia (n = 26) compared with MLL-wt (n = 75) patients (MLL-wt, leukemia patients not harboring MLL gene translocation). (Mann-Whitney test; *P < 0.05; ***p < 0.001). The expression level was calculated using the 2-ΔCT method and was normalized to that of GAPDH. f ChIP-qPCR detection of BRD4, POL II, and MLL fusion protein enrichment at the SEELA1 and SEELA2 gene loci in MV4-11 and RS4;11 cells after treatment with i-BET151. The error bars indicate the ± SEM values (*P < 0.05; **P < 0.01; ***P < 0.001; ns, no significant difference) in three independent experiments

