Fig. 7.
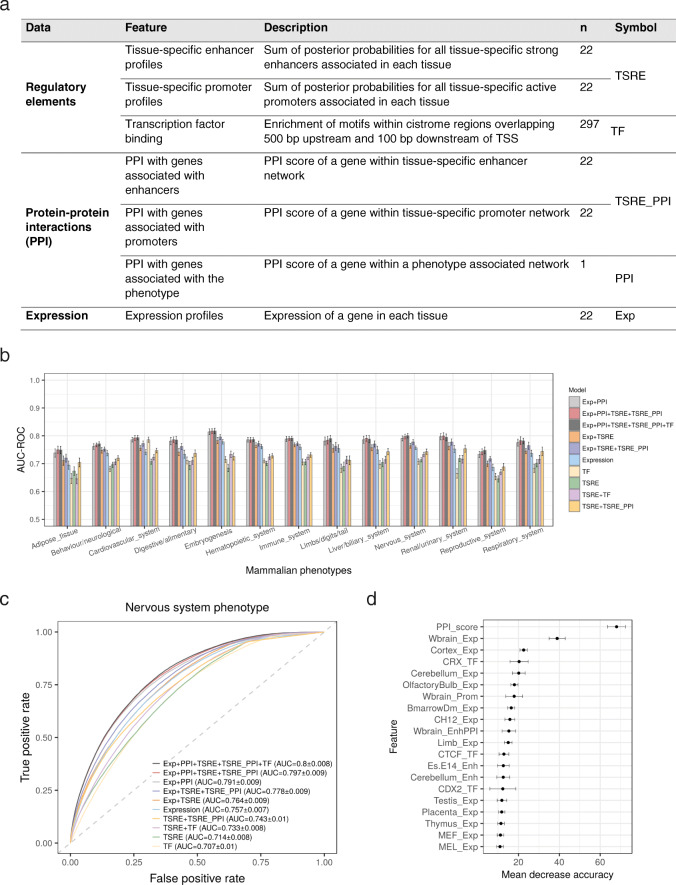
Predicting gene-phenotype associations in mouse. a Summary of the various gene features (grouped according to their data sources) used to train the random forest classifier to predict gene-phenotype associations. b Bar plot comparing the predictive power of different random forest classifiers across various phenotypes. Error bars denote standard deviation. The classifier trained on all gene features performs the best for majority of the phenotype domains. c Receiver operating characteristic (ROC) curves comparing the performance of 10 random forest classifier models applied to predict genes associated with nervous system phenotype. d Feature importance chart of the best performing model (Exp + PPI + TSRE+TSRE_PPI + TF) showing the top 20 predictor variables important in nervous system phenotype predictions, as measured by the mean decrease in accuracy (x-axis). The PPI feature was identified to be the most important in predicting genes associated with nervous system phenotype, followed by expression in whole brain and cortex. Exp: expression; Enh: enhancer; Prom: promoter; TF: transcription factor. See also Additional file 1: Figure S16 and S17

