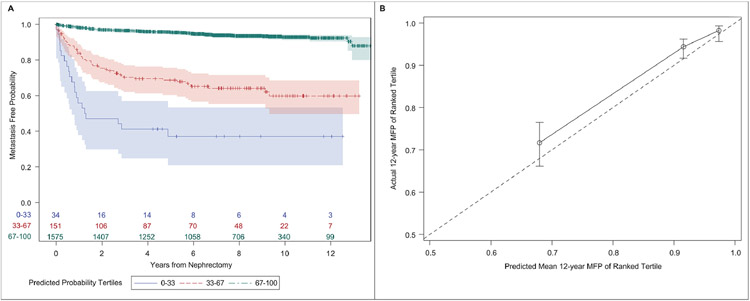
Figure 3 –
(A) Kaplan-Meier plot of metastasis-free probability stratified by tertiles of predicted 12-year metastasis-free probability in the cohort; (B) Calibration plot of the nomogram fit in the cohort of patients who underwent nephrectomy for localized renal tumor (n=1,760). The circles represent the predicted mean and actual 12-year MFS with the bars representing confidence limits around the estimate. The dashed line represents the 45-degree line

