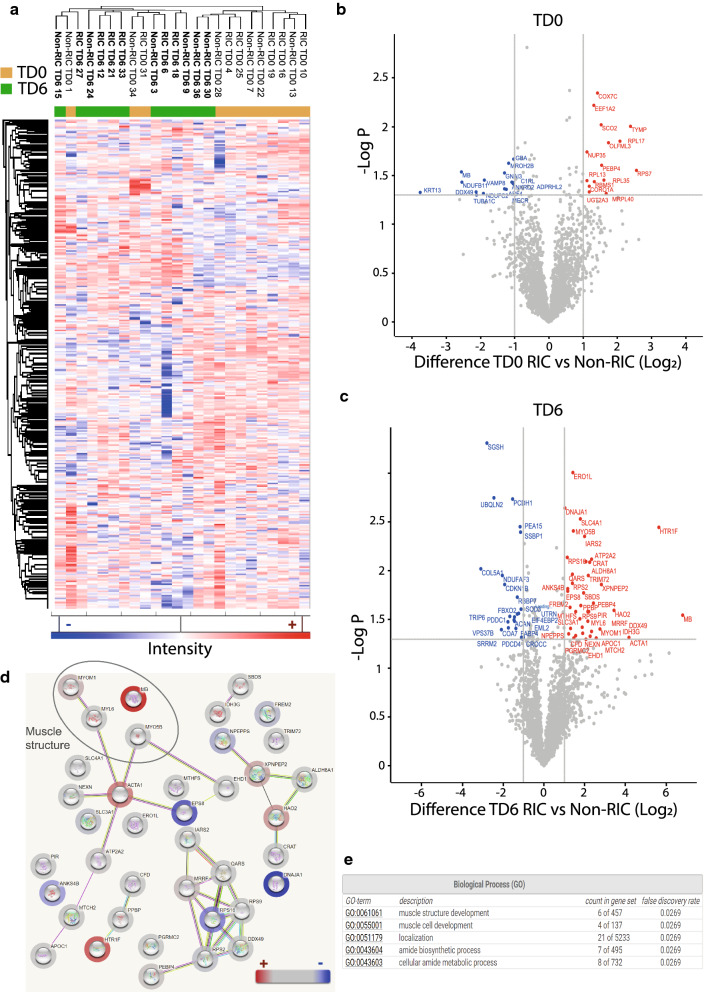
Fig. 2.
RIC versus non-RIC kidney tissue proteome profiles. Hierarchical clustering of kidney tissue proteome profiles using Euclidian distance (a). Volcano plot showing differential protein expression between RIC and non-RIC at baseline (TD0) (b) and between RIC and non-RIC 6 days post-transplant (TD6) (c). X-axis: protein level difference indicated by log2 fold change, Y-axis: statistical significance indicated by -log10 (p-value). Overall, 30 and 62 proteins, for A and B respectively, have a fold change greater than 2 (at a p-value < 0.05). Up-regulated proteins are highlighted in red, while their down-regulated counterparts are coloured blue. d Biological pathways reflected by elevated proteins in kidney tissues at day 6 (TD6), RIC versus non-RIC (Table S2). Halos in red / blue indicate the abundance levels of proteins used in this analysis. e Enriched biological process (GO-terms) from proteins shown in d

